
FIGURE 6.
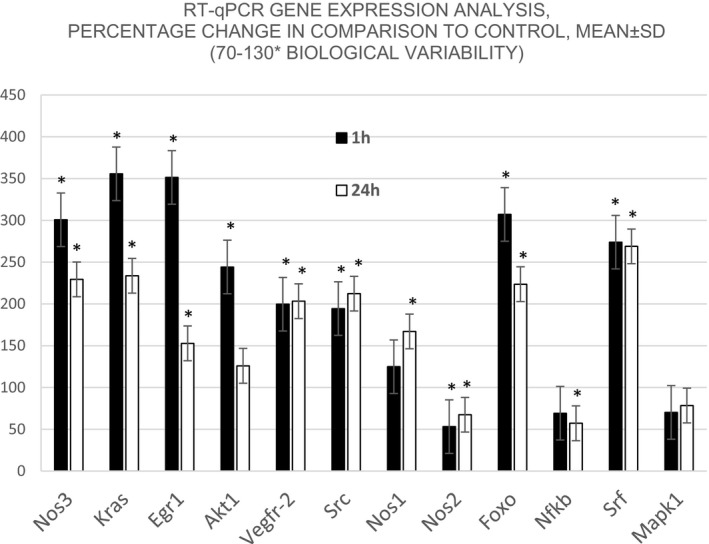
RT‐qPCR changes in mRNA levels in the hippocampus (CA1‐4 regions) expressed as percentages (mean ± SD, * marks significant value (p ≤ .05), in comparison with control animals. Selected genes were tested in two‐time intervals, 1 hr (black bars) and 24 hr (white bars), respectively. Values in the range between 70% and 130% are considered biological variability, while those under that range are under‐regulated and those above that range are upregulated