
Figure 3.
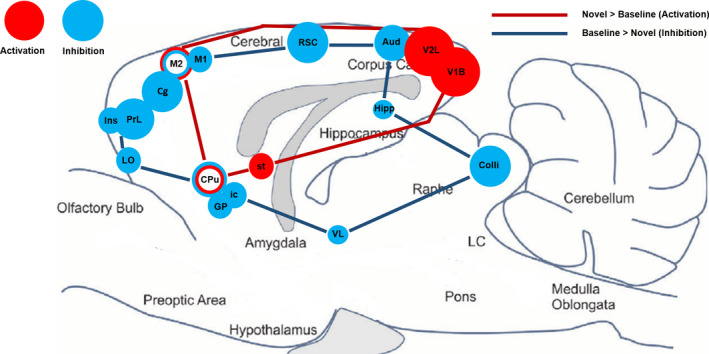
Summary of functional imaging results. Sagittal brain drawing (0.40 mm lateral) showing all regions of statistically significant brain glucose metabolism activation (red) and inhibition (blue) in the rat brain in response to a novel environment. Significant clusters identified for p < .01, voxel threshold K > 50. Circle diameter corresponds to cluster size