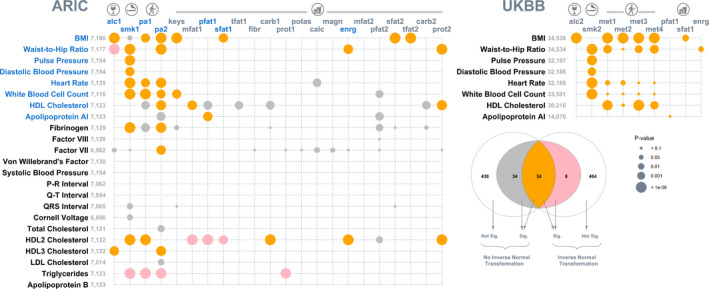
Figure 2.

Bubble plot of P values that identify lifestyle modulation of genetic and nongenetic effects on cardiovascular traits.
For each of the 23 cardiovascular traits (along the y axis) from the ARIC Study, 22 lifestyle covariates (along the x axis) were screened separately for genotype–covariate and residual–covariate interactions by comparing a multivariate reaction norm model that allows genotype–covariate and residual–covariate interactions (ie, a full model) with a null model that assumes no genotype–covariate and residual–covariate interactions (left). The 506 null model versus full model comparisons were repeated after a rank‐based inverse normal transformation was applied to all traits for a sensitivity analysis. Signals (after Bonferroni correction) for data before and after the transformation are color coded, as detailed in the Venn diagram (bottom right). A total of 34 signals (in orange) remained after the sensitivity analysis. Of these remaining signals, 17 were subject to validation using the UKBB, and their corresponding traits and lifestyle covariates are highlighted in blue. The results of the UK biobank validation are shown (top right). For both data sets, bubbles are proportional to P values based on data after the rank‐based inverse normal transformation. Note the exceptions to the sample size displayed for BMI versus sfat1 (N=16 257) and for waist‐to‐hip ratio versus enrg (N=16 254) in the UKBB because of the limited availability of dietary intake data among the selected participants. alc1 indicates alcohol intake (g/week); alc2, alcohol intake (glass and pint/week); ARIC, Atherosclerosis Risk in Communities; BMI, body mass index; calc, calcium intake (mg/d); carb1, carbohydrate intake (g/d); carb2, energy from carb1 (%kcal/d); enrg, total energy intake (kcal/d); fibr, dietary fiber intake (g/d); HDL, high‐density lipoprotein; keys, keys score; LDL, low‐density lipoprotein; magn, magnesium intake (mg/d); met1, summed metabolic equivalent minutes/week for all activity; met2, metabolic equivalent minutes/week for walking; met3, metabolic equivalent minutes/week for moderate activity; met4, metabolic equivalent minutes/week for vigorous activity; mfat1, monounsaturated fatty acid intake (g/d); mfat2, energy from mfat1 (%kcal/d); pa1, physical activity: leisure domain; pa2, physical activity: sports domain; pfat1, polyunsaturated fatty acid intake (g/d); pfat2, energy from pfat1 (%kcal/d); potas, potassium intake (mg/d); prot1, protein intake (g/d); prot2, energy from prot1 (%kcal/d); sfat1, saturated fatty acid intake (g/d); sfat2, energy from sfat1 (%kcal/d); Sig., significant; smk1, cigarette years of smoking; smk2, pack years adult smoking as proportion of life span exposed to smoking; tfat1, total fat intake (g/d); and tfat2, energy from tfat1 (%kcal/d); and UKBB, UK Biobank.
