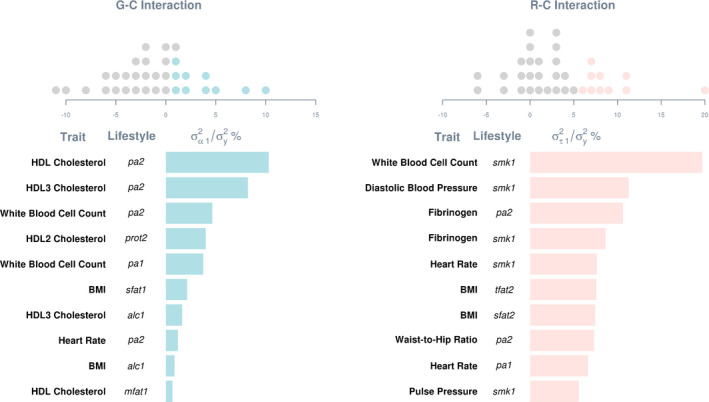
Figure 3.

Variance estimates of G‐C and R‐C interactions as percentages of total phenotypic variance.Estimates were derived by fitting a multivariate reaction norm model that included both G‐C and R‐C interactions (ie, a full model) to data without a rank‐based inverse normal transformation. Dot plots on the top show distributions of estimates relative to the phenotypic variance of respective traits. Estimates are included only for signals that remained after a sensitivity analysis, where the full model was better than the null after Bonferroni correction on data after a rank‐based inverse normal transformation. Top ten estimates are shown in bar charts below. alc1 indicates alcohol intake (g/week); BMI, body mass index; G‐C, genotype–covariate; HDL, high‐density lipoprotein; mfat1, monounsaturated fatty acid intake (g/d); pa1, physical activity: leisure domain; pa2, physical activity: sports domain; prot2, energy from protein intake (%kcal/d); R‐C, residual–covariate; , variance of G‐C interaction effects; , phenotypic variance; , variance of R‐C interaction effects; sfat1, saturated fatty acid intake (g/d); sfat2, energy from saturated fatty acid intake (%kcal/d); smk1, cigarette years of smoking; and tfat2, energy from total fat intake (%kcal/d).
