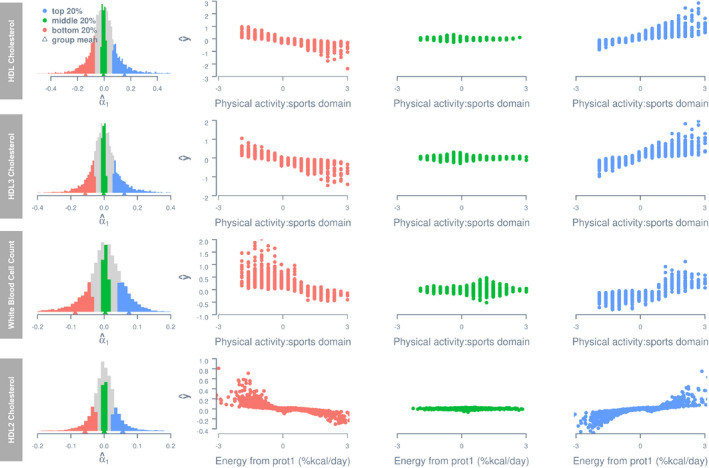
Figure 4.

Estimated phenotypes as a function of lifestyle covariates for groups stratified by per‐individual estimate of genotype–covariate interaction effect.
Histograms on the left show distributions of per‐individual estimates of a genotype–covariate interaction effect, that is, α1. The estimated phenotype of any given individual i is computed using the equation , where c denotes the lifestyle covariate value recorded for i, and and denote the estimated main genetic effect and genotype–covariate interaction effect for i. Only the first 4 traits with the largest variance estimate of genotype–covariate interaction effects are shown. All phenotypes and lifestyle covariates are standardized. HDL, high‐density lipoprotein; and prot1, protein intake (g/d).
