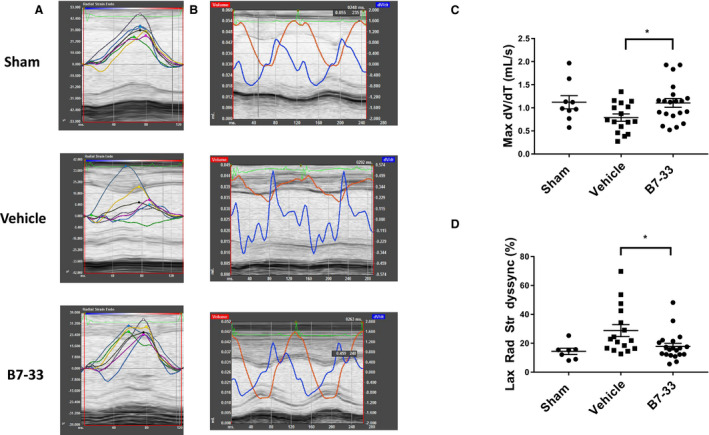
Figure 3. Analysis of long‐axis echocardiography views 24 hours post MI.

A, Representative tracings from experimental groups demonstrating radial velocity vs time, with individual colors representing the 6 long‐axis left ventricular segments to calculate radial strain dyssynchrony. B, Representative tracings from experimental groups depicting dV/dT as a function of time, with the local maxima corresponding to peak relaxation velocity, estimated via speckle tracking analysis. C, Preserved Max dV/dT in B7‐33–treated group (1.11±0.09 mL/s for B7‐33 vs 0.79±0.08 mL/s for vehicle) 24 hours post myocardial infarction (MI). D, Reduced left ventricular radial strain dyssynchrony in B7‐33–treated group 24 hours post MI (17.51±2.17% vs 28.77±4.13% for vehicle; P<0.05). Dyssynchrony was calculated from SD of left ventricular segmental radial strains, and expressed as a percentage of average radial strain. For C and D, n=9 for sham and n=15 to 21 for vehicle and B7‐33 groups. For C and D, 1‐way ANOVA was used to determine significance, and if P<0.05, Holm‐Sidak test was used for post hoc analysis. *P<0.05.
