
Figure 3.
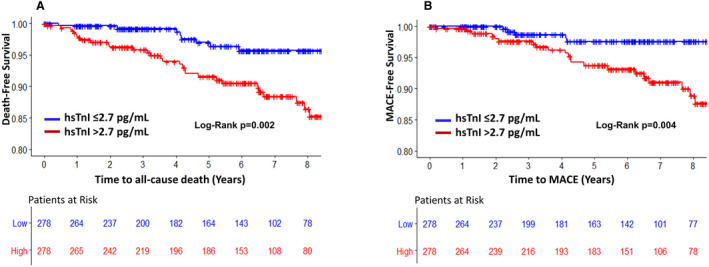
Kaplan‐Meier curves for association between levels of high‐sensitivity troponin I (hsTnI) identified by the median (2.7 pg/mL) for all‐cause death (A) and major cardiovascular adverse events (MACE) (B).
Official websites use .gov
A
.gov website belongs to an official
government organization in the United States.
Secure .gov websites use HTTPS
A lock (
) or https:// means you've safely
connected to the .gov website. Share sensitive
information only on official, secure websites.
Kaplan‐Meier curves for association between levels of high‐sensitivity troponin I (hsTnI) identified by the median (2.7 pg/mL) for all‐cause death (A) and major cardiovascular adverse events (MACE) (B).