
Figure 2. Intrasubject comparison of body mass index (BMI) and percentage body fat (%BF) for categorizing adiposity.
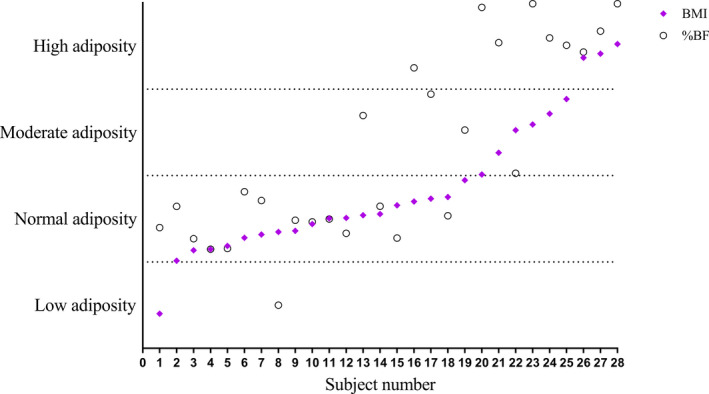
Values are expressed as a percentage of the participant's categorical range for both BMI and %BF cut points. There was only 61% agreement between BMI and %BF for categorizing adiposity in patients with a Fontan circulation.