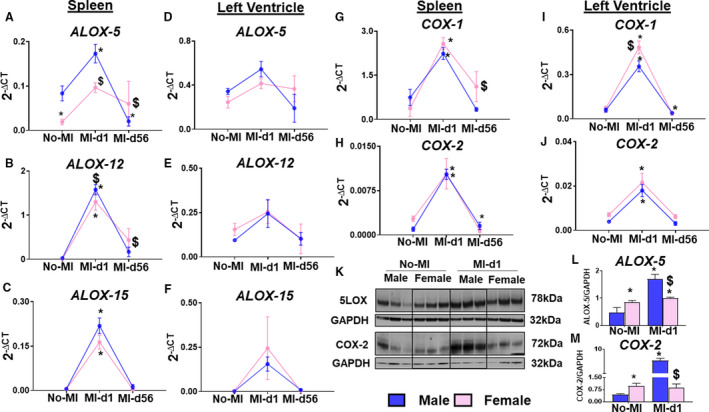
Figure 4. Male mice have a higher level of lipoxygenase (LOX) expression, whereas female mice express higher cyclooxygenases (COXs) after MI.

A through F, Line graphs of LOXs (ALOX5, ALOX12, ALOX15) in the spleen and left ventricle of male and female mice from No‐MI to MI‐d1. G through J, Bar graphs of COXs (COX1, COX2) in the left ventricle of male and female mice from No‐MI to MI‐d1 (no‐MI: males [n=4], females [n=4]; MI‐d1: males [n=6], females [n=6]). *P<0.05 vs no‐MI naïve controls; $ P<0.05 vs male at respective time point. K through M, Western blot representative and bar graphs of protein expression of ALOX5 and COX2 (n=3/group). *P<0.05 vs no‐MI naïve controls; $ P<0.05 vs male at respective time point.
