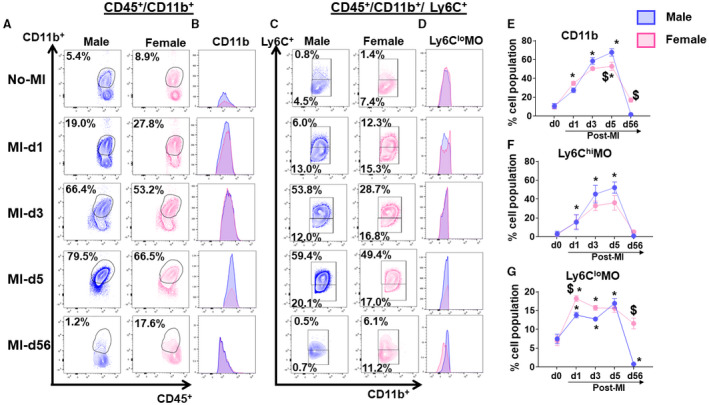
Figure 6. Female mice show higher reparative monocytes compared with male mice after myocardial infarction (MI).

(A) Plot showing cluster of differentiation (CD)11b+ (monocytes) cells at No‐MI, MI‐d3, MI‐d5, and MI‐d56 in male and female mice. (B) Histograms showing monocytes expression at No‐MI, MI‐d3, MI‐d5, and MI‐d56 in male and female mice. (C) Plot showing cluster of Ly6Chi and Ly6Clo cells at No‐MI, MI‐d3, MI‐d5, and MI‐d56 in male and female mice. (D) Histograms showing Ly6Chi and Ly6Clo monocytes expression at No‐MI, MI‐d3, MI‐d5, and MI‐d56 in male and female mice. (E, F, G) Line graphs showing the percentage of the cell population for CD11b, Ly6Chi monocytes (MO), and Ly6CloMO. [No‐MI: males (n=4), females (n=4); MI‐d1: males (n=5), females (n=6); $ P<0.05 vs male at respective time point; *P<0.05 compared with no‐MI naïve controls.
