
Figure 8. Male mice have increased expression of cytokines in the spleen, female mice have increased expression of cytokines in the left ventricle.
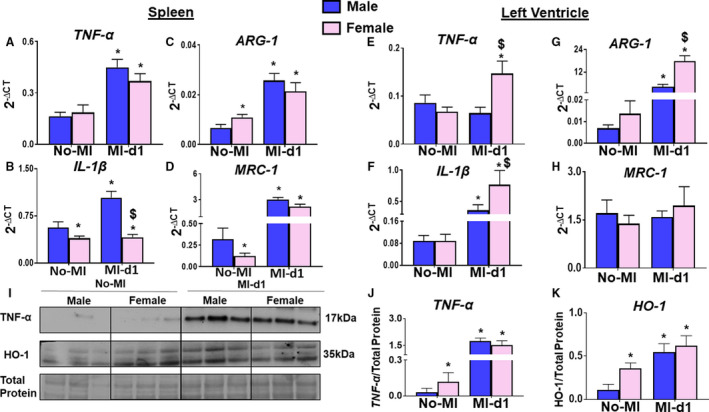
(A‐D) Bar graphs of increased tumor necrosis factor (TNF)‐α, interleukin (IL)‐1β, Arginase 1 (ARG‐1), Mannose Receptor C‐Type 1 (MRC‐1) in the spleen of male mice from no‐MI to MI‐d1. (E‐H) Bar graphs of increased TNF‐α, IL‐1β, ARG‐1, MRC‐1 in the left ventricle of female mice from no‐MI to MI‐d1. no‐MI: males (n=4), females (n=4); MI‐d1: males (n=6), females (n=6); *P<0.05 compared with no‐MI naïve controls, $ P<0.05 vs male at respective time point. (I‐K) Western representative and bar graphs of expression of TNF‐α and heme oxygenase‐1 (HO1). [(n=3/group); *P<0.05 compared with no‐MI naïve controls, $ P<0.05 vs male at respective time point.