Figure 4.

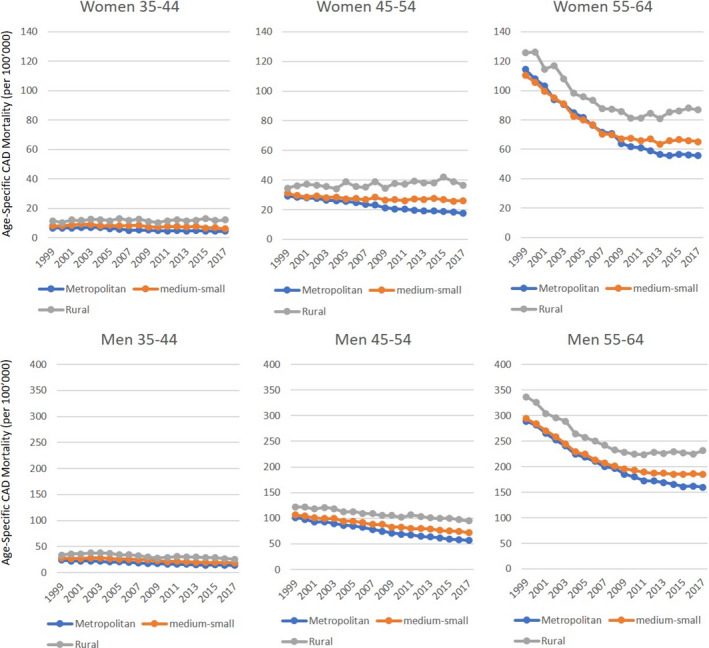
Age‐specific mortality rates according to age groups, sex, and urbanization. These are the same data reported in Figure 2 and Table 2, but presented with the same scale for comparison purposes.

Age‐specific mortality rates according to age groups, sex, and urbanization. These are the same data reported in Figure 2 and Table 2, but presented with the same scale for comparison purposes.