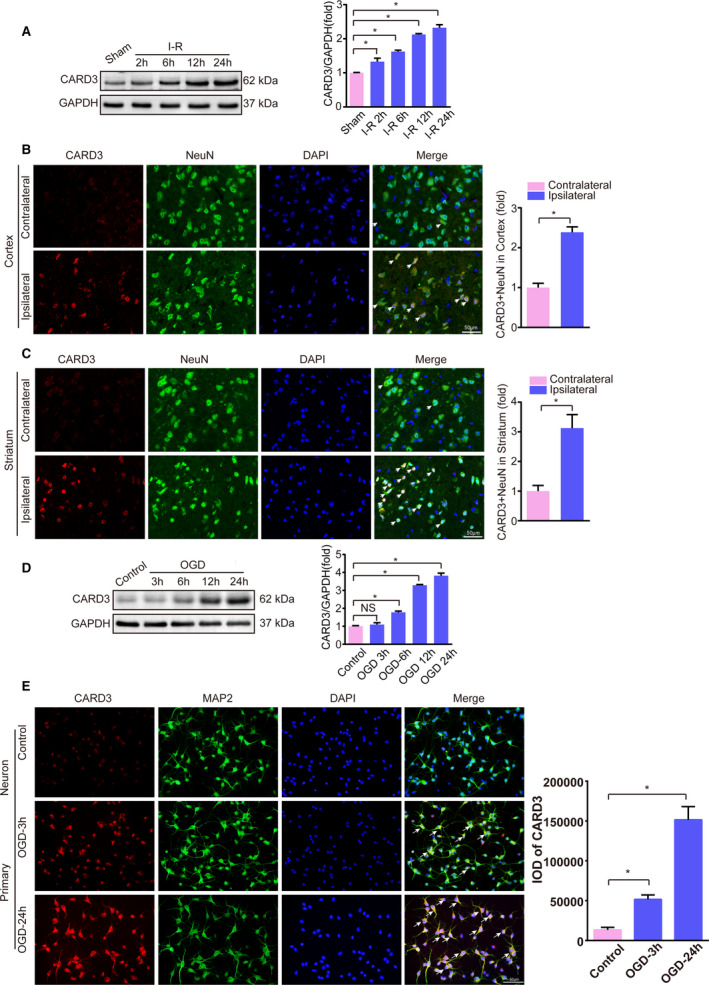
Figure 1. Expression of CARD3 (caspase activation and recruitment domain 3) is upregulated in neurons after experiencing ischemia‐reperfusion (I‐R) in vivo and in vitro.

A, Western blotting showed the expression of CARD3 in mice experiencing I‐R injury at indicated time points. Error bar shown as mean±SEM. Statistical analysis was performed by Student t test, *P<0.05 vs sham group. GAPDH served as loading control, n=6 mice per group. B and C, Brain sections were stained for NeuN (neuronal nuclear protein; green), CARD3 (red), and DAPI (blue) in the ischemic cortex (upper) and striatum (lower) after reperfusion for 24 hours, and the white arrows showed CARD3‐positive neurons. Right bar reflected the relative level of CARD3‐positive neurons in the ischemic cortex and striatum. Data were represented as mean±SD. Statistical analysis was performed by Student t test, *P<0.05 vs contralateral, n=5 mice. Scale bars, 50 μm. D, In vitro, the level of CARD3 in primary neurons subjected to OGD (oxygen and glucose deprivation) for 1 hour and reoxygenation for indicated time point was analyzed by Western blotting. Error bar shown as mean±SD. Statistical analysis was performed by Bonferroni post hoc or Tamhane's T2 analysis, *P<0.05 vs the control group., *P<0.05 vs control. GAPDH served as loading control. E, Neurons were also stained with MAP2 (microtubule associated protein 2; green), CARD3 (red) and DAPI (blue) after suffering to OGD reperfusion at indicated time points. All data were presented as mean±SD. Statistical analysis was performed by one‐way analysis of variance (ANOVA), followed by Bonferroni post hoc or Tamhane's T2 analysis, *P<0.05 vs the control group. Three independent experiments were repeated. IOD indicates integrated option density. Scale bars, 50 μm.
