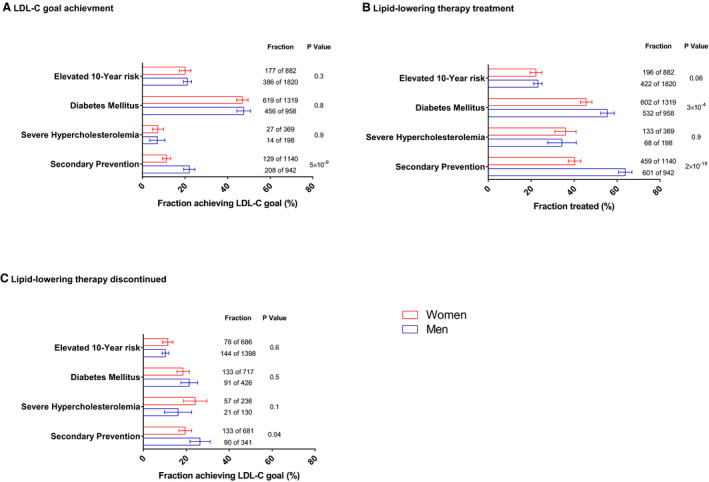
Figure 2. Fraction of patients achieving low‐density lipoprotein cholesterol (LDL‐C) goal, treated with lipid lowering therapy, and discontinuing lipid‐lowering therapy.

The percentages of patients in each patient‐management group who have achieved LDL‐C goal (A), who are receiving lipid‐lowering therapy (B), and who have discontinued lipid‐lowering therapy (of those not receiving therapy) (C) are presented for women (red) and men (blue). Error bars are 95% CIs. The number of patients in each fraction as well as the total number of patients is indicated. P values are age‐adjusted for the difference between fractions in women and men.
