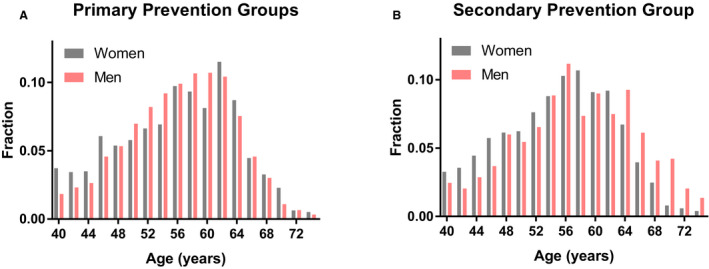
Figure 3. Age distribution in primary and secondary prevention groups.

Histograms of age for patients with low‐density lipoprotein cholesterol (LDL‐C) above goal in the primary prevention groups (A) and the secondary prevention group (B). Histograms are plotted for women (gray) and men (pink).
