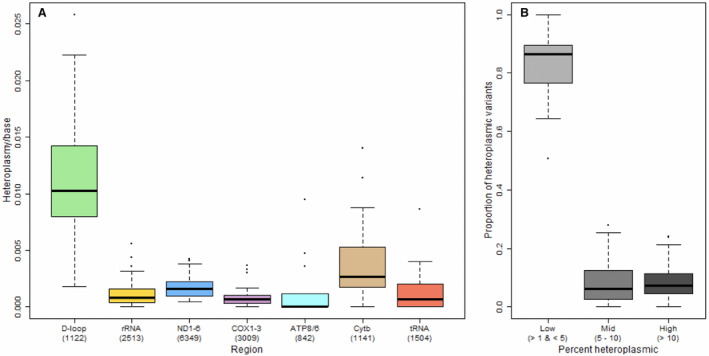
Figure 1. Distribution of heteroplasmic variants by region and frequency in the whole study sample (n=42).

A, Rate of heteroplasmy (heteroplasmy count per base) by mitochondrial DNA region among all participants; (B) proportion of heteroplasmic variants categorized as low (microheteroplasmy), mid, or high frequency. Parentheses indicate the number of bases used to calculate rate for each region. D‐loop indicates displacement loop; and mtDNA, mitochondrial DNA.
