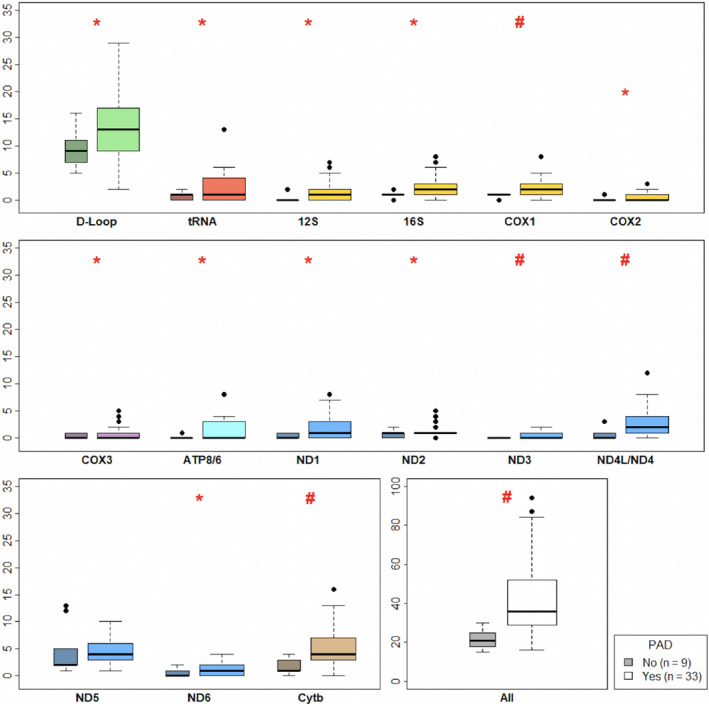
Figure 2. Heteroplasmy count by mitochondrial DNA region and peripheral artery disease status (n=42, darker boxes=non‐peripheral artery disease; lighter boxes=peripheral artery disease; *P<0.05 and # P<0.01).

mtDNA indicates mitochondrial DNA; and PAD, peripheral artery disease.
