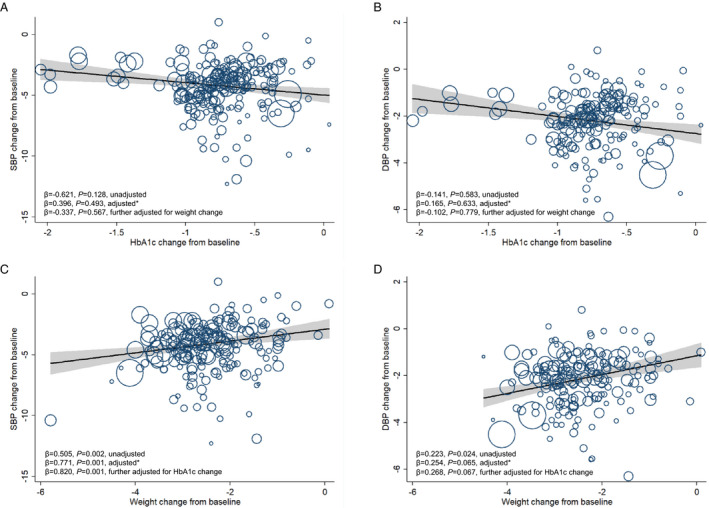
Figure 5. Meta‐regression analysis of the associations between hemoglobin A1c (HbA1c) reduction or body weight reduction and blood pressure changes in sodium‐glucose cotransporter‐2 inhibitor (SGLT2i) treatment.

A, Association between HbA1c change from baseline and systolic blood pressure (SBP) change from baseline. B, Association between HbA1c change from baseline and diastolic blood pressure (DBP) change from baseline. C, Association between weight change from baseline and SBP change from baseline. D, Association between weight change from baseline and DBP change from baseline. The size of circles is proportional to the weight of each study in the meta‐regression. *Analyses were adjusted for age, sex, body mass index (BMI), and duration of diabetes mellitus.
