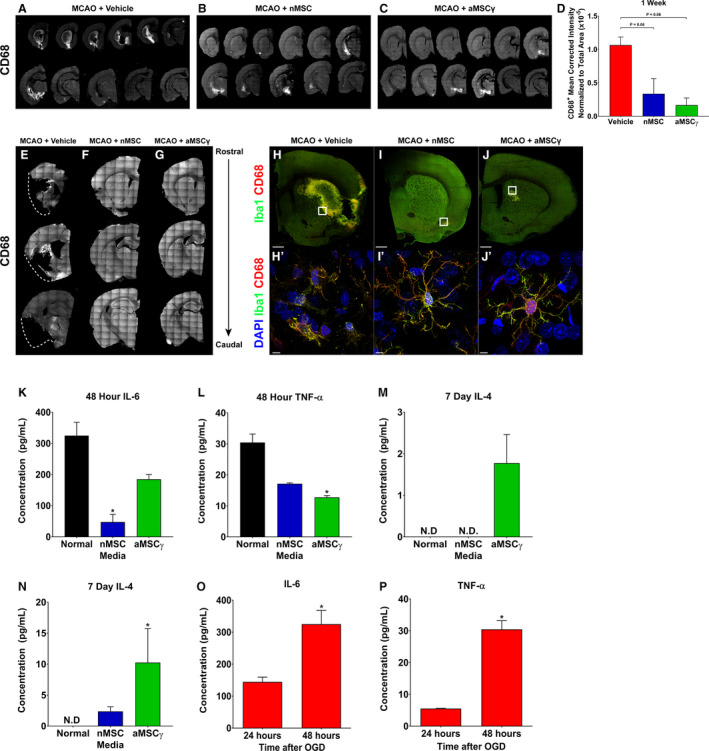
Figure 2. Mesenchymal stem cells (MSC) reduce microglia activation and inflammatory signaling.

A through C, Representative images of CD68 staining of brain sections spaced 300 μm apart through the whole brain from middle cerebral artery occlusion (MCAO)+vehicle (A), MCAO+nMSC (B), and MCAO+aMSCγ (C) animals 1 week after surgery and treatment. D, Quantitation of CD68 staining 1 week after surgery and treatment. Data are mean±SEM; n=3 to 4 animals per group. Data were analyzed using nonparametric Kruskal‐Wallis 1‐way ANOVA. E through G, Representative images of CD68 staining of brain sections spaced 300 μm apart through the whole brain from MCAO+vehicle (E), MCAO+nMSC (F), and MCAO+aMSCγ (G) animals 3 weeks after surgery and treatment. Dashed lines (E) approximate the location of the lateral border of the tissue in a normal brain. H through J, Representative confocal images of whole brain slices of MCAO+vehicle (H), MCAO+nMSC (I), and MCAO+aMSCγ (J) animals 1 week after surgery and treatment stained for Iba1 (green) and CD68 (red). Scale bar represents 1 mm. H’ through J’, Representative confocal images at high magnification from the white boxes in H through J stained for DAPI (blue), Iba1 (green), and CD68 (red). Scale bar represents 5 μm. K through N, Concentration of interleukin 6 (IL‐6) (K), tumor necrosis factor α (TNF‐α) (L), IL‐4 (M), and IL‐10 (N) secreted by primary microglia after priming in oxygen and glucose deprivation (OGD) and then growth in normal (black), nMSC‐conditioned medium (blue), or aMSCγ conditioned medium (green). IL‐6 and TNF‐α were assayed at 48 hours, and IL‐4 and IL‐10 were assayed at 7 days. Data are mean±SEM; n=3 independent experiments. Data were analyzed using a nonparametric Kruskal‐Wallis 1‐way ANOVA. N.D., not detected, *Compared with Normal, *P≤0.05. O and P, Concentration of IL‐6 (O) and TNF‐α (P) secreted by primary microglia after OGD. Data are mean±SEM; n=3 independent experiments. Data were analyzed using a 2‐tail, unpaired t test. *P≤0.05. aMSCγ indicates interferon‐γ–activated mesenchymal stem cells; and nMSC, naive mesenchymal stem cells.
