
Figure 3. Interferon‐γ–activated mesenchymal stem cells (aMSCγ) induce oligodendrogenesis following middle cerebral artery occlusion (MCAO).
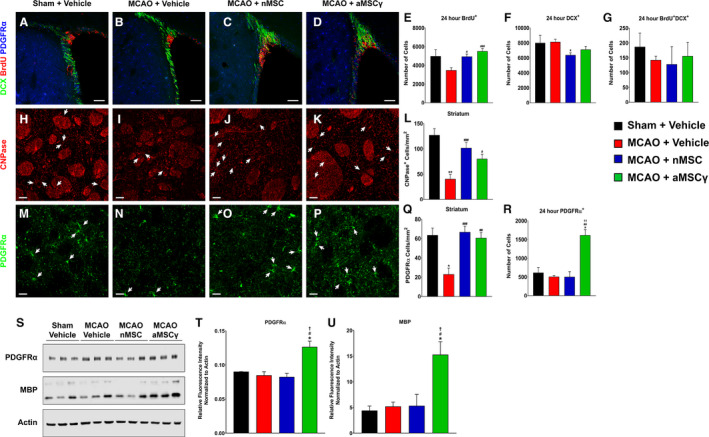
A through D, Representative confocal images of the ipsilateral SVZ from sham+vehicle (A) MCAO+vehicle (B), MCAO+nMSC (C), and MCAO+aMSCγ (D) animals 24 hours after surgery and treatment stained for doublecortin (DCX, green), bromodeoxyuridine (BrdU, red), and platelet‐derived growth factor receptor α (PDGFRα, blue). Scale bar represents 100 μm. E through G, Quantification of total numbers of BrdU+ cells (E), DCX+ cells (F), and BrdU+DCX+ cells (G) in the ipsilateral SVZ 24 hours after MCAO. Data are mean±SEM; n=3 animals for the sham group and n=5 to 6 animals for the remaining groups. Data were analyzed using nonparametric Kruskal‐Wallis 1‐way ANOVA. *Compared with sham+vehicle. #Compared with MCAO+vehicle. *P≤0.05, # P≤0.05. H through K, Representative confocal images of the ipsilateral striatum from sham+vehicle (H), MCAO+vehicle (I), MCAO+nMSC (J), and MCAO+aMSCγ (K) animals 3 weeks after surgery and treatment stained for 2′3′‐cyclic‐nucleotide 3′‐phosphodiesterase (CNPase, red). Scale bar represents 20 μm. L, Quantification of CNPase+ cells in the ipsilateral striatum. Data are mean±SEM; n=3 animals per group. Data were analyzed using nonparametric Kruskal‐Wallis 1‐way ANOVA. *Compared with sham+vehicle. #Compared with MCAO+vehicle. **P<0.01, # P≤0.05, ### P<0.001. M through P, Representative confocal images of the ipsilateral striatum from sham+vehicle (M), MCAO+vehicle (N), MCAO+nMSC (O), and MCAO+aMSCγ (P) animals 3 weeks after surgery and treatment stained for PDGFRα (green). Scale bar represents 20 μm. Q, Quantification of PDGFRα+ cells in the ipsilateral striatum. Data are mean±SEM; n=3 animals per group. Data were analyzed using nonparametric 1‐way Kruskal‐Wallis ANOVA. *Compared with sham+vehicle. #Compared with MCAO+vehicle. *P≤0.05, ## P<0.01, ### P<0.001. R, Quantification of total numbers of PDGFR+ cells in the ipsilateral subventricular zone (SVZ) 24 hours after MCAO. Data are mean±SEM; n=3 animals for the sham group and n=5 to 6 animals for the remaining groups. Data were analyzed using nonparametric Kruskal‐Wallis 1‐way ANOVA. *Compared with sham+vehicle. #Compared with MCAO+vehicle. †Compared with MCAO+nMSC. *P≤0.05, ## P<0.01, †† P<0.01. S through U, Western blots of the oligoprogenitor marker PDGFRα and mature oligodendrocyte marker MBP (myelin basic protein) (S) and their quantification (T and U) from brain homogenate from the ipsilateral hemisphere 1 week after surgery and treatment normalized to actin. Data are mean±SEM; n=3 animals per group. Data were analyzed using nonparametric Kruskal‐Wallis 1‐way ANOVA. *Compared with sham+vehicle. #Compared with MCAO+vehicle. †Compared with MCAO+nMSC. *P≤0.05, # P≤0.05, † P≤0.05. nMSC indicates naive mesenchymal stem cells.