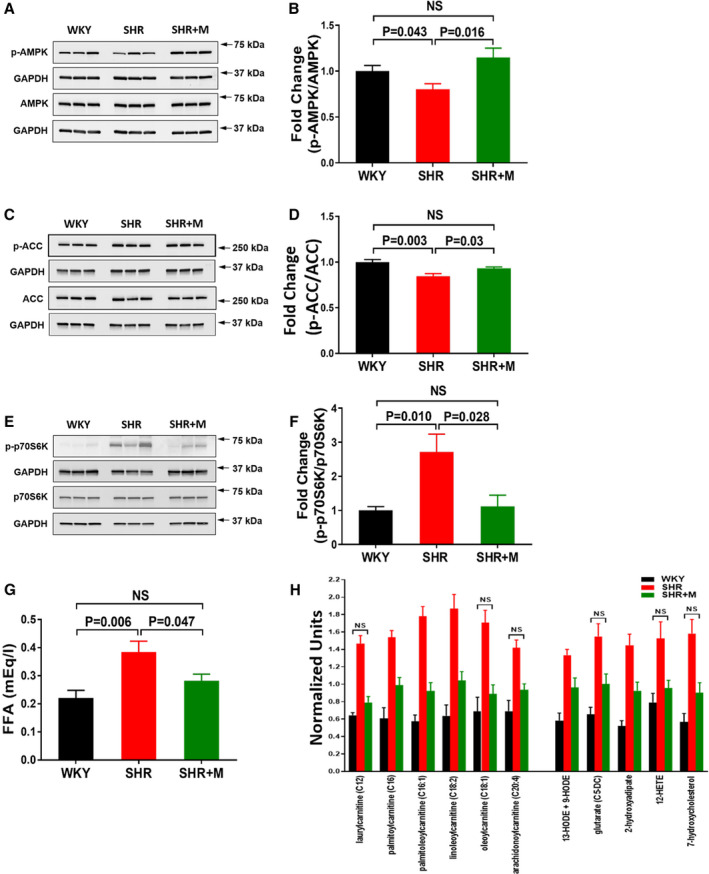
Figure 3. Effects of metformin treatment on cardiac AMPK and ACC phosphorylation and mTOR activity, and on cardiac and circulating metabolites in SHR.

A, Immunoblots for p‐AMPK and (B) signal intensities for p‐AMPK and AMPK normalized to GAPDH and p‐AMPK/AMPK ratios determined. C, Immunoblots for p‐ACC and (D) signal intensities for p‐ACC and ACC normalized to GAPDH and p‐ACC/ACC ratios determined. E, Immunoblots for p‐p70S6K, a marker for mTOR activity, and (F) signal intensities for p‐p70S6K and p70S6K normalized to GAPDH and p‐p70S6K/p70S6K ratios determined. G, FFA in circulation. A through G, Data for WKY (n=6), SHR (n=6), and SHR treated with metformin (300 mg/kg per day) for 3 months (SHR+M [n=6]). H, Changes in cardiac fatty acyl carnitines (left) and lipid oxidation and peroxidation products (right) in SHR treated with metformin (100 mg/kg per day) (n=10) for 1 month from 1 to 2 months of age when compared with untreated WKY (n=10) and SHR (n=9). Data for biochemicals in raw area counts were rescaled to set medians equal to 1 and plotted. Data for untreated SHR and WKY were reported in our earlier study5 and are shown here for comparison with treated SHR. Data for WKY vs SHR, SHR vs SHR+M, and WKY vs SHR+M were statistically significantly different at P<0.05 except for the ones marked NS (WKY vs SHR+M). All data are shown as mean±SE. ACC indicates acetyl‐CoA carboxylase; FFA, free fatty acids; M, metformin; mTOR, mammalian target of rapamycin; SHR, spontaneously hypertensive rats; WKY, Wistar–Kyoto.
