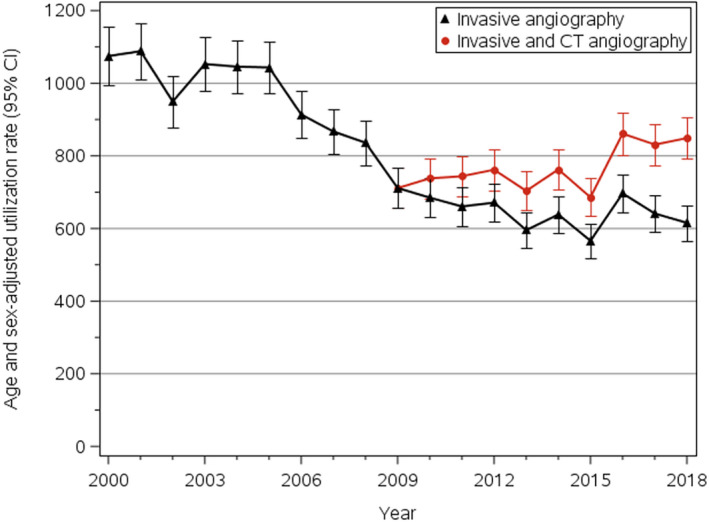
Figure 1.

Trends in coronary angiography usage in Olmsted County, MN, 2000 to 2018. Yearly rates (95% CIs), per 100 000 people, have been standardized by the direct method to the age and sex distribution of the US 2010 total population. CT indicates computed tomography.
