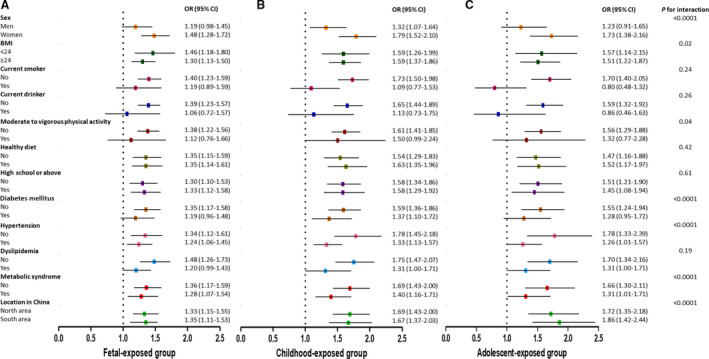
Figure 2. Stratification analysis of famine exposure and risk of CVD according to basic factors including age, sex, smoking and drinking status, physical activity, diet status, educational status, diabetes mellitus (no/yes), hypertension (no/yes), dyslipidemia (no/yes), metabolic syndrome (no/yes), and north/south of China in fetal‐exposed (A), childhood‐exposed (B), and adolescent‐exposed (C) groups, respectively.

Different colors are used to distinguish the stratification factors. The model is adjusted for age, sex, BMI, educational status, smoking and drinking status, physical activity, famine severity, healthy diet (yes/no), and metabolic syndrome (yes/no). The square in the middle represents the odds ratio of the risk estimation, and the bar represents its 95% CI. BMI indicates body mass index; CVD, cardiovascular disease; OR, odds ratio.
