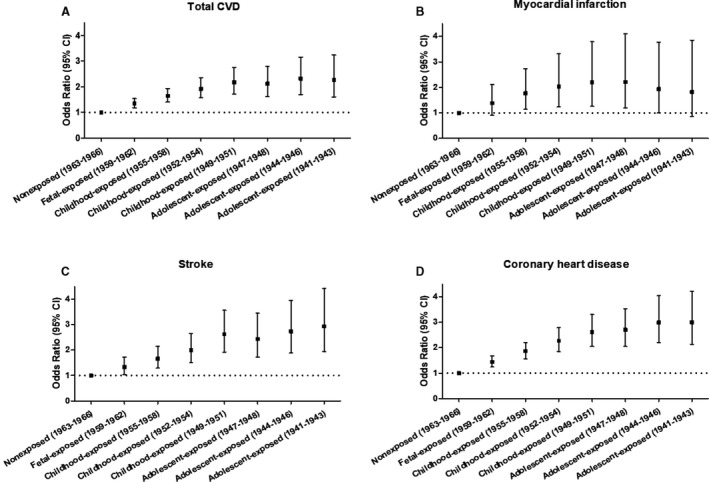
Figure 3. Finer classification according to famine exposure duration in the estimation of risk for total cardiovascular disease (A), myocardial infarction (B), stroke (C), and coronary heart disease (D), respectively.

Finer classification of the exposure duration including 8 groups: (1) born between January 1, 1959 and December 31, 1962, fetal exposed (n=29 387); (2) born between January 1, 1955 and December 31, 1958, childhood exposed (n=41 929); (3) born between January 1, 1952 and December 31, 1954, childhood exposed (n=32 994); (4) born between January 1, 1949 and December 31, 1951, childhood exposed (n=27 447); (5) born between January 1, 1947 and December 31, 1948, adolescent exposed (n=15 198); (6) born between January 1, 1944 and December 31, 1946, adolescent exposed (n=18 040); (7) born between January 1, 1941 and December 31, 1943, adolescent exposed (n=14 699); (8) born between January 1, 1963 and December 31, 1966, nonexposed (n=29 738). The model adjusted for age, sex, BMI, educational status, smoking and drinking status, physical activity, famine severity, healthy diet (yes/no), and metabolic syndrome (yes/no). The black square represents the odds ratio of the risk estimation, and the bar represents its 95% CI. BMI indicates body mass index; CVD, cardiovascular disease.
