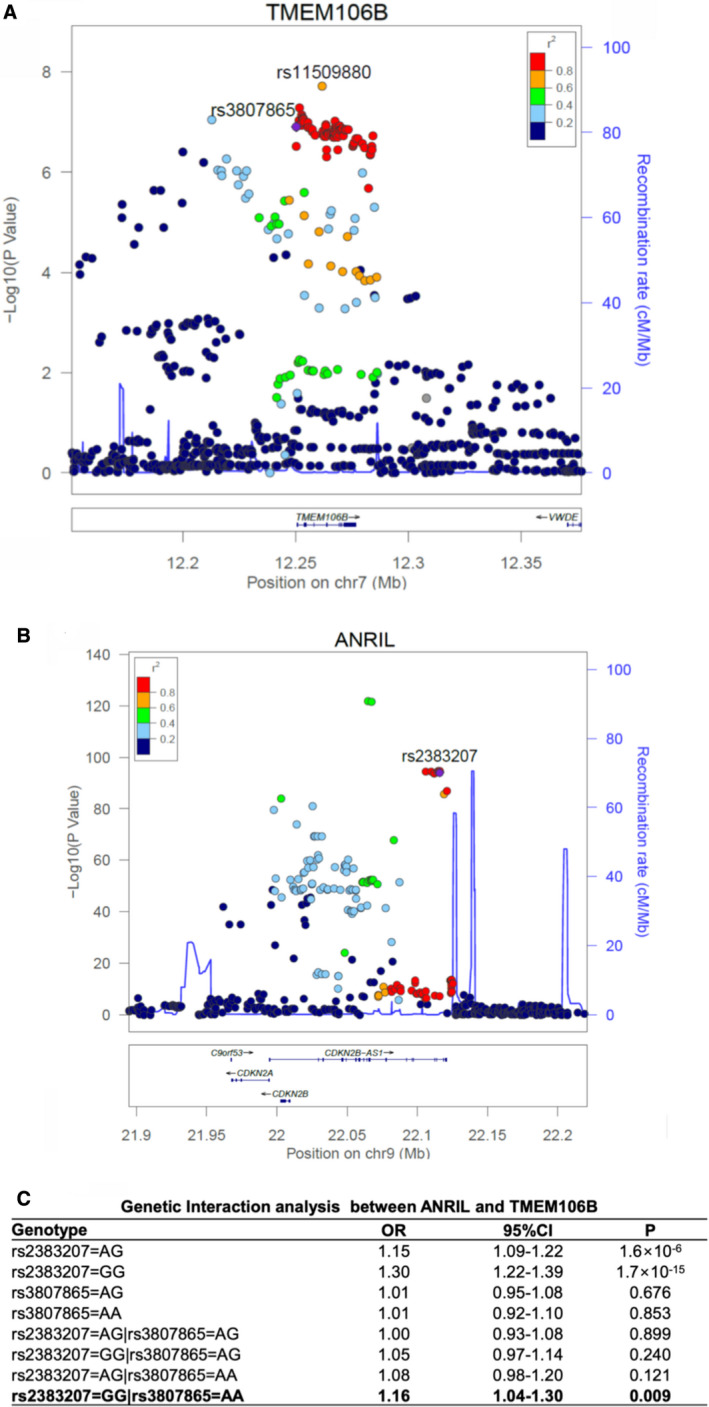
Figure 9.

Genetic evidence for epistasis involving the ANRIL and TMEM106B GWAS (genome‐wide association studies) loci for coronary artery disease (CAD).
A, Regional association plot of TMEM106B from a meta‐analysis of 2 large CAD GWAS data sets. The recombination rate as plotted in centi‐morgan (cM)/Mb (a million base pair) and genetic association as plotted in the scale of ‐log10 are shown. Color of the individual dot indicates the linkage disequilibrium between the lead single nucleotide polymorphism (purple dot) and other single nucleotide polymorphisms. The displayed linkage disequilibrium data and recombination rates are based on the European population in the 1000 Genome database. B, Regional association plot of ANRIL from a meta‐analysis of 2 large CAD GWAS data sets. C, Significant genetic interaction between ANRIL variant rs2383207 and TMEM106B variant rs3807865 in 343 145 unrelated samples in UK Biobank. Genetic interactions between 2 genes were assessed using a logistic regression model, in which 2 main effects of each gene and 4 interactions between genes were modeled. The non‐risk homozygote was set as the reference for each gene. Statistical analysis was performed as described in Methods section. OR indicates odds ratio; P, P value from the logistic regression model with adjustment of covariates.
