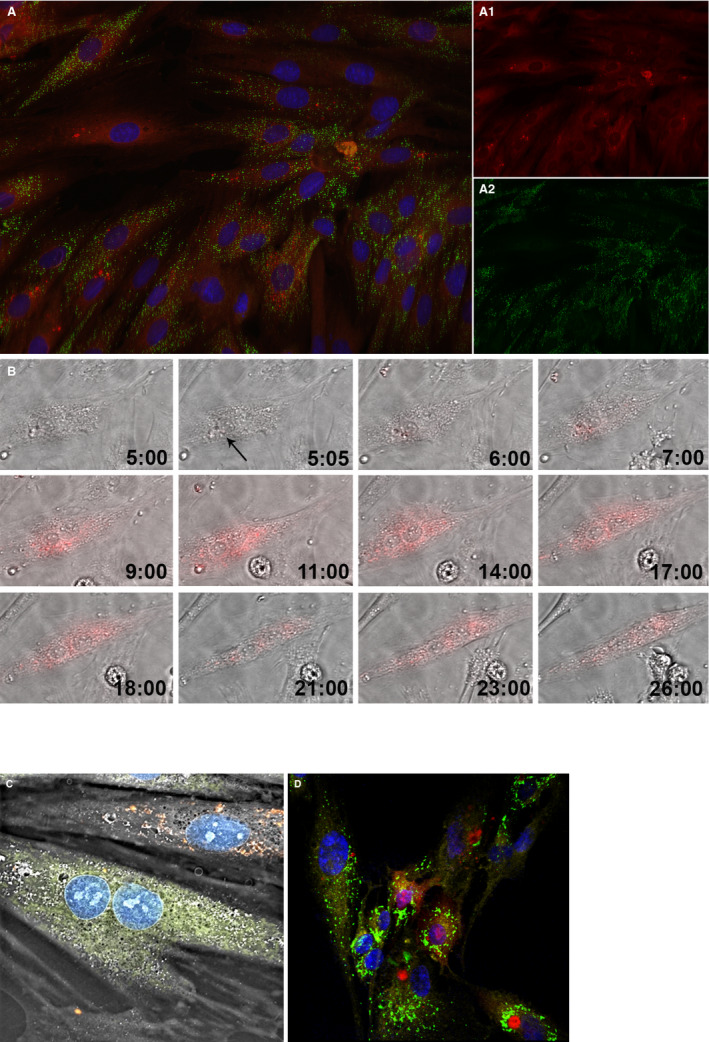
Figure 2.

Internalization of mitochondria into H9c2 cardiomyocyte‐like cells through coincubation. (A) Feasibility of mitochondrial transplantation. The newly internalized mitochondria labeled with pHrodo Red Succinimidyl Ester (A.1.); the cell's native mitochondria labeled with MitoTracker Green FM (A.2.); the nucleus is labeled with NucBlue Live. The image was taken after 28 hours time‐lapse using a structured illumination epifluorescence microscope (Keyence, Itasca, IL). (B) Dynamics of mitochondrial internalization. Hour 5:00 represents the cardiomyocytes before mitochondrial internalization. Media contains the fluorescently labeled mitochondria. Given that pHrodo Red SE fluoresces brightly red only after it has been internalized by the cell, no florescence could yet be observed. At 5:05, the cardiomyocyte starts taking in the mitochondria, as indicated by the red fluorescence signal (black arrow). As time passes, more mitochondria are internalized into the cell. Moreover, there are interactions between the mitochondria, which are assumed to represent the dynamics of fusion and fission processes (Olympus, Tokyo, Japan). (C) Non‐autologous transplantation of mitochondria. Mitochondria from rat L6 skeletal muscle cell (shown in red) were transplanted into H9c2 cardiomyocytes (Nanolive SA, Tolochenaz, Switzerland). (D) Interspecies transplantation of mitochondria. Mitochondria from rat L6 skeletal muscle cells (shown in red) were transplanted into human ARPE‐19 retinal epithelial cells. The cell's native mitochondria are shown in green, the transpalnted mitochondria in red, the nucleus in blue, and the plasma membrane, labeled with CellMask Deep Red Plasma Membrane Stain, in yellow (Zeiss Microscopy, Jena, Germany).
