Figure 5.

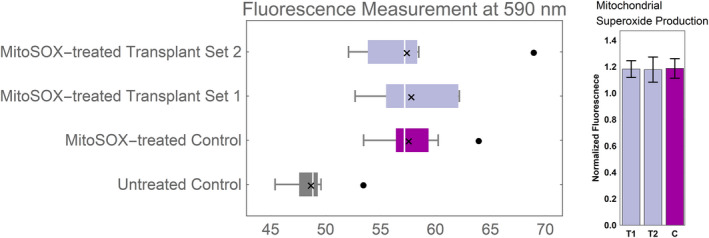
Mitochondrial superoxide production. H9c2 cells were exposed to MitoSOX Red reagent 48 hours after mitochondrial transplantation to measure superoxide production. MitoSOX Red was excited at 485 nm, and fluorescence emission was measured at 590 nm. Whisker box plot shows distribution of fluorescence readings for 10 measurements per group. No statistically significant difference was observed in the population's mean of the post‐transplant groups vs control. Fluorescence measurements of MitoSOX‐treated groups were normalized to the untreated control and are displayed as bar graphs, for the mean±SD. Symbols: White line denotes the population median, “x” indicates the population mean, and filled black dots represent outliers.
