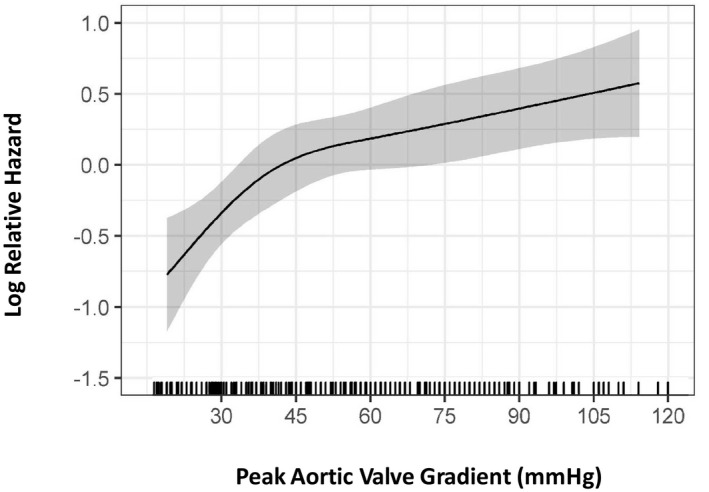
Figure 6.

Relationship between relative hazard (y axis) and peak aortic valve gradient (x axis) in a subset of 357 mixed aortic valve disease patients who did not undergo aortic valve intervention during follow‐up. Visual analysis of the curves shows a steep increase in relative hazard as the peak aortic valve gradient reaches 45 mm Hg, after which the hazard plateaus. This nonlinear impact of peak aortic valve gradient was modeled using restricted cubic splines in a multivariable Cox proportional hazards model (see Methods for details). Grayscale area represents 95% CIs.
