
Figure 1. Box plots of coronary plaque results for fatty, fibrous, noncalcified, and total plaque shown in Table 2.
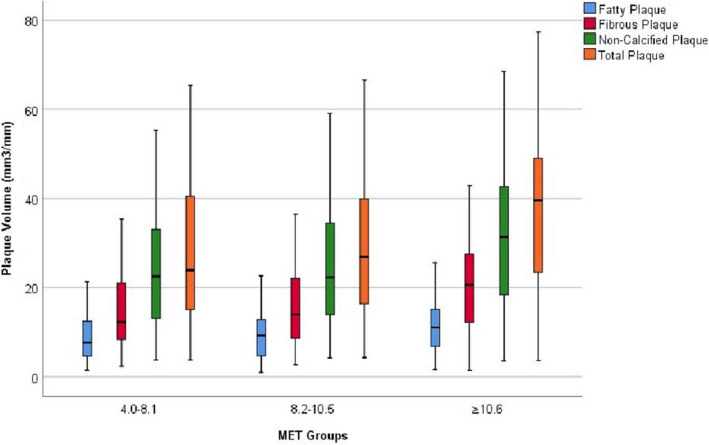
The horizontal bar is the median with the 25th percentile (first quartile; Q1) and 75th percentile (third quartile; Q3) represented by the bars below and above the median, respectively. The lower end of the whiskers is calculated as (Q1–1.5*IQR [interquartile range]) and the upper end of the whiskers is calculated as (Q3+1.5*IQR). Adjusted P values for comparison among the 3 groups as shown in Table 2 are: fatty plaque: 0.23; fibrous plaque: 0.028; non‐calcified plaque: 0.064 and total plaque: 0.038. IQR indicates interquartile range; MET, metabolic equivalents of task.