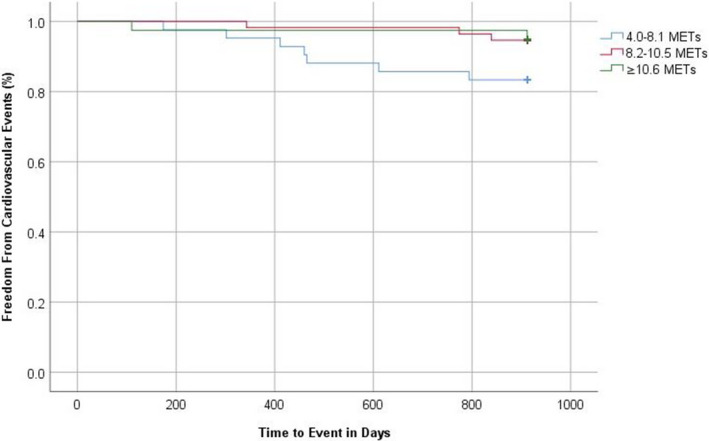
Figure 4. Kaplan–Meier plots for time to cardiovascular events for the 3 MET groups for those with CAC score >400.

The combination of MET groups 2 and 3 had significantly fewer cardiovascular outcomes (P=0.037). CAC indicates coronary artery calcium score; MET, metabolic equivalents of task.
