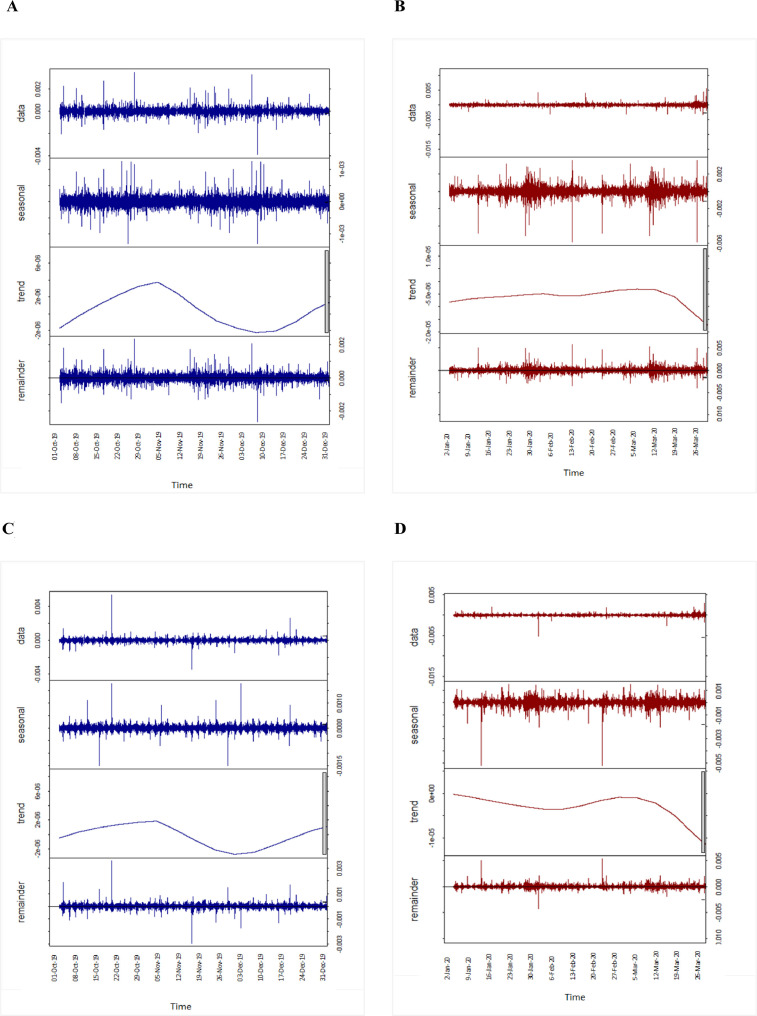
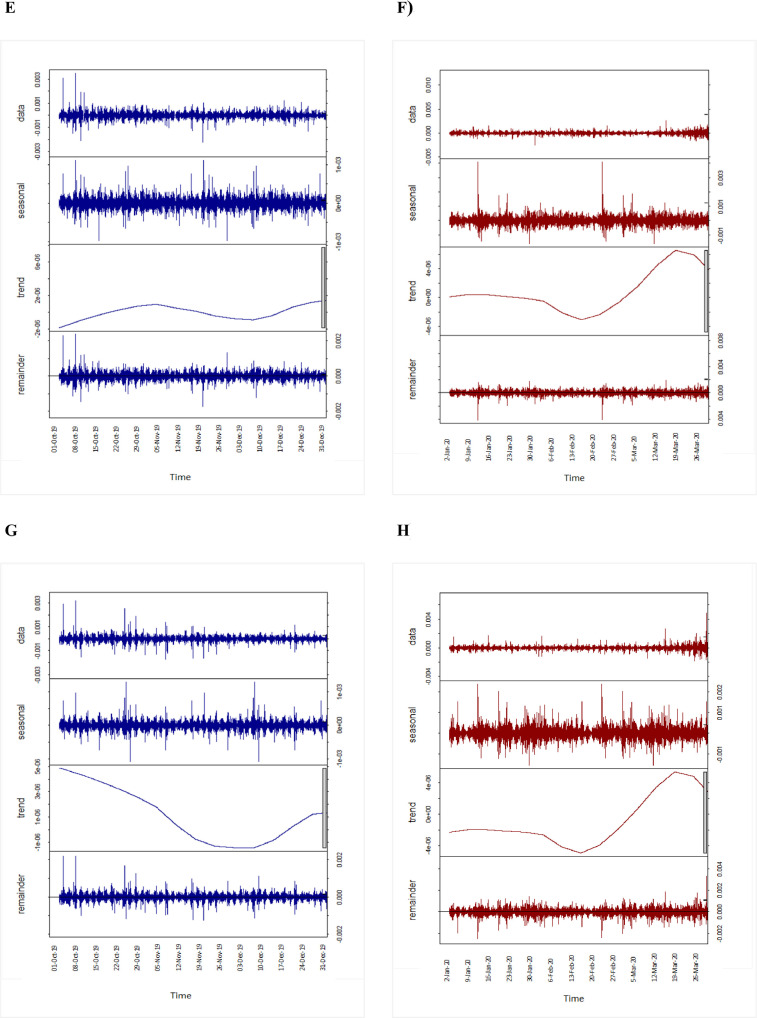
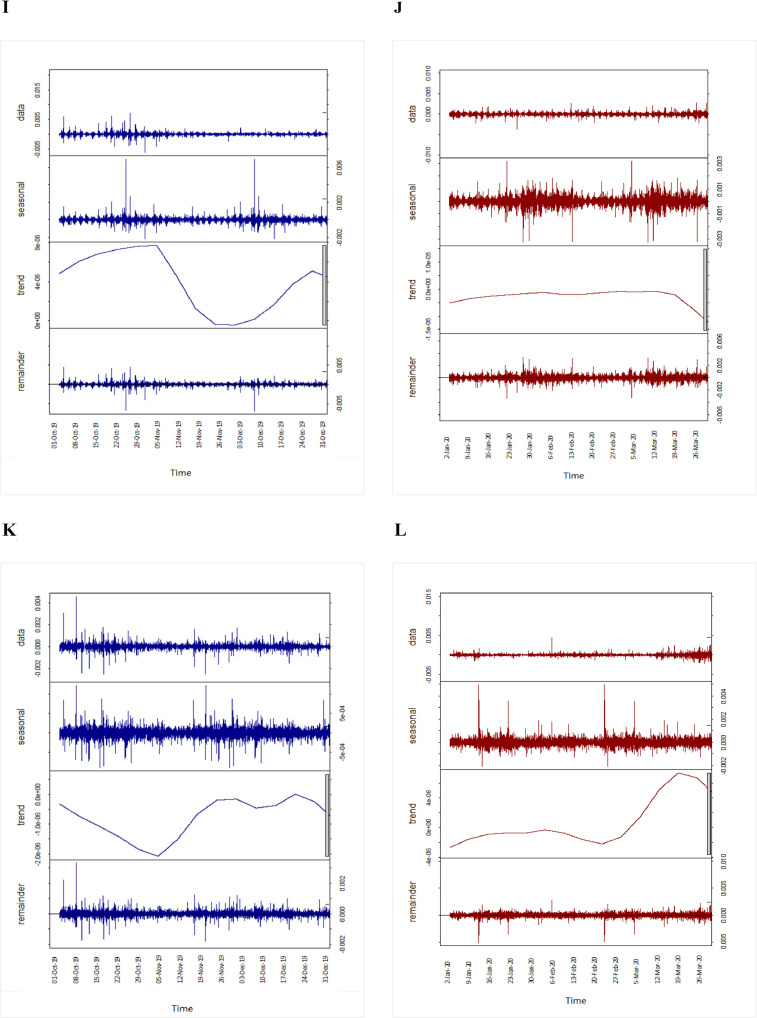
Fig. 2.
STL decomposition of intraday (five-minute) exchange rate returns for 2019 (blue) and 2020 (red). Row 1: Original five-minute time series; row 2: seasonal component; row 3: trend component; row 4: remainder. STL = seasonal-trend decomposition using loess; see Table 1 for explanation of the currency codes. (For interpretation of the references to colour in this figure legend, the reader is referred to the web version of this article.)


