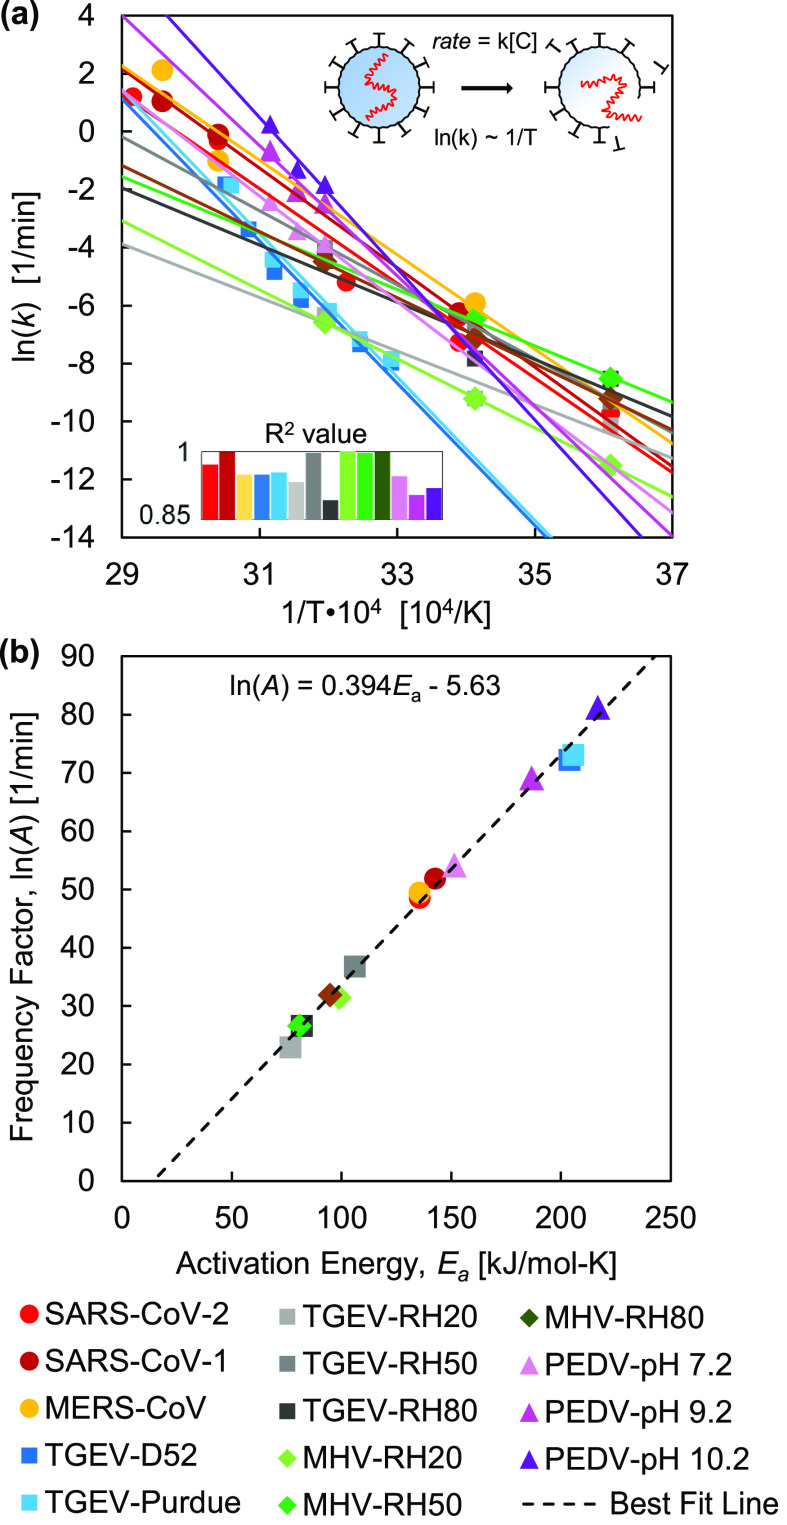
FIG. 1.
Thermal inactivation behavior of coronaviruses. An Arrhenius plot (a) shows the dependence of inactivation rate constant on temperature for the coronaviruses. Each coronavirus dataset was fitted using linear regression [Eq. (2)], where the inserted chart presents the R2 values for the linear fits. The resulting activation energy, Ea, and frequency factor, ln(A), were back-calculated from each linear fit according to Eq. (2) and plotted (b); the linear correlation between ln(A) and Ea indicates protein denaturation.22,41

