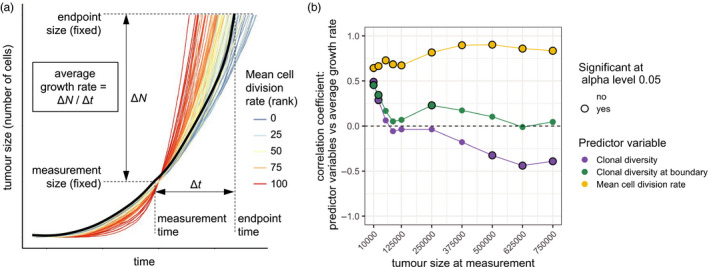
Figure 1.

Correlations between predictor variables and future tumour growth rate for cohorts of tumours with identical parameter values. (a) Example tumour growth trajectories. In this cohort, tumours with higher mean cell division rate (red curves) typically have higher future growth rate, which results in a positive correlation coefficient. One trajectory is shown in black to illustrate the method used to calculate average growth rate. (b) Correlation coefficients between predictor variables and subsequent tumour growth rate, for different measurement sizes. Correlation coefficients that significantly differ from zero (p < .05) are indicated by black rings. Each point represents a cohort of 100 simulated tumours; lines are added only to guide the eye. Parameter values are K = 512, μ = 10−5, s = 0.1
