Figure 2.

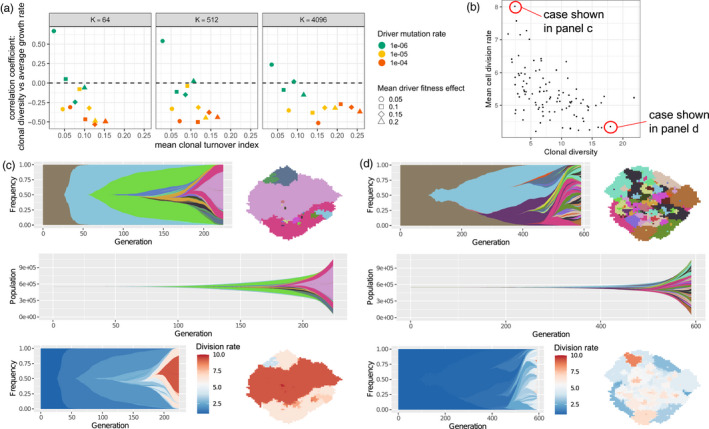
Higher clonal diversity can be associated with slower future tumour growth. (a) Correlation coefficients between clonal diversity (measured at a tumour size of 250,000 cells) and subsequent tumour growth rate, plotted against mean clonal turnover index. Each point represents a cohort of 100 simulated tumours. (b) An example of a tumour cohort exhibiting negative correlation between clonal diversity (measured at a tumour size of 750,000 cells) and mean cell division rate (Spearman's correlation coefficient − 0.55; p < 10−8). (c) A simulated tumour from this cohort exhibiting a succession of selective sweeps, resulting in high mean cell division rate, high growth rate and low clonal diversity. Top left is a Muller plot in which colours represent clones with distinct combinations of driver mutations (the original clone is grey‐brown; subsequent clones are coloured using a recycled palette of 26 colours). Descendant clones are shown emerging from inside their parents. Top right is a spatial plot of the tumour at the endpoint time, in which each pixel corresponds to a deme containing approximately K cells, coloured according to the most abundant clone within the deme. The middle row shows a Muller plot of clone sizes, rather than frequencies. In the bottom row, clones in the Muller and spatial plots are coloured by cell division rate. (d) A simulated tumour from the same cohort exhibiting low mean cell division rate, low growth rate and high clonal diversity due to extensive clonal interference. Parameter values in panels b–d are K = 512, μ = 10−5, s = 0.2. Muller plots were drawn using the ggmuller R package (Noble, 2019b)
