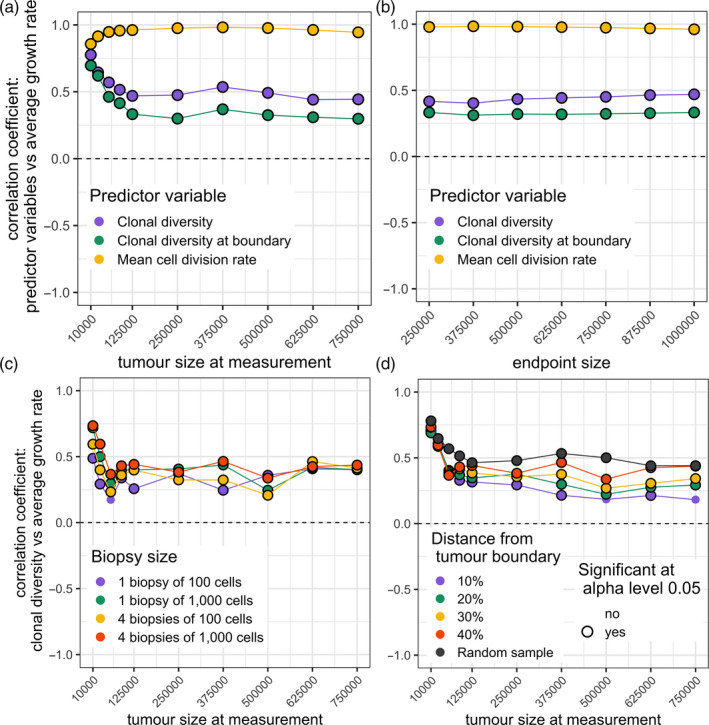
Figure 3.

Correlation coefficients for cohorts of tumours with diverse driver mutation rates. (a) Correlation coefficients between predictor variables and subsequent tumour growth rate, for different measurement sizes. (b) Correlation coefficients between predictor variables (measured at a tumour size of 125,000 cells) and subsequent tumour growth rate, for different endpoint sizes. (c) Correlation coefficients between future tumour growth rate and clonal diversity, measured in biopsy samples of different number and size (at a depth of 40% from the tumour edge), for different measurement sizes. (d) Correlation coefficients between future tumour growth rate and clonal diversity, measured in biopsy samples taken at different depths relative to the tumour edge (four biopsy samples, each of 1,000 cells, are taken from each tumour), for different measurement sizes. Correlation coefficients that significantly differ from zero (p < .05) are indicated by black rings. In all plots, each point represents a cohort of 100 simulated tumours; lines are added only to guide the eye. Parameter values are K = 512 and s = 0.1. The driver mutation rate of each tumour is chosen by sampling a random value X from a continuous uniform distribution between 4 and 6 and then setting μ = 10− X
