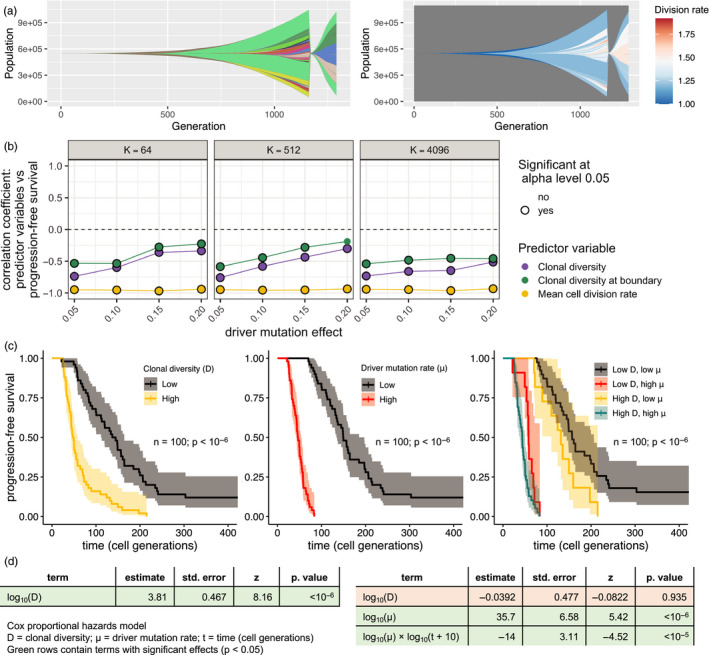
Figure 4.

Forecasting progression‐free survival in tumours with diverse driver mutation rates. (a) Muller plots for a simulated tumour that is treated and regrows to its pretreatment size. In the left panel, colours represent clones with distinct combinations of driver mutations (using a recycled palette of 26 colours). Descendant clones are shown emerging from inside their parents. In the right panel, clones are coloured by cell division rate. (b) Correlation coefficients between predictor variables measured immediately before treatment and progression‐free survival (time to regrow to pretreatment size). (c) Kaplan–Meier curves for progression‐free survival in a cohort of tumours (parameter values K = 512 and s = 0.05). Tumours are grouped by pretreatment clonal diversity (first panel); driver mutation rate (second panel); or both pretreatment clonal diversity and driver mutation rate (third panel). For grouping, values above and below the median are classed as high and low, respectively. The endpoint size is one million cells. The driver mutation rate of each tumour is chosen by sampling a random value X from a continuous uniform distribution between 4 and 6 and then setting μ = 10− X. To facilitate comparison, colours are consistent with figure 7 of Turajlic et al. (2018). (d) Results of two alternative survival analyses using the Cox proportional hazards model (see Section 2 for further details)
