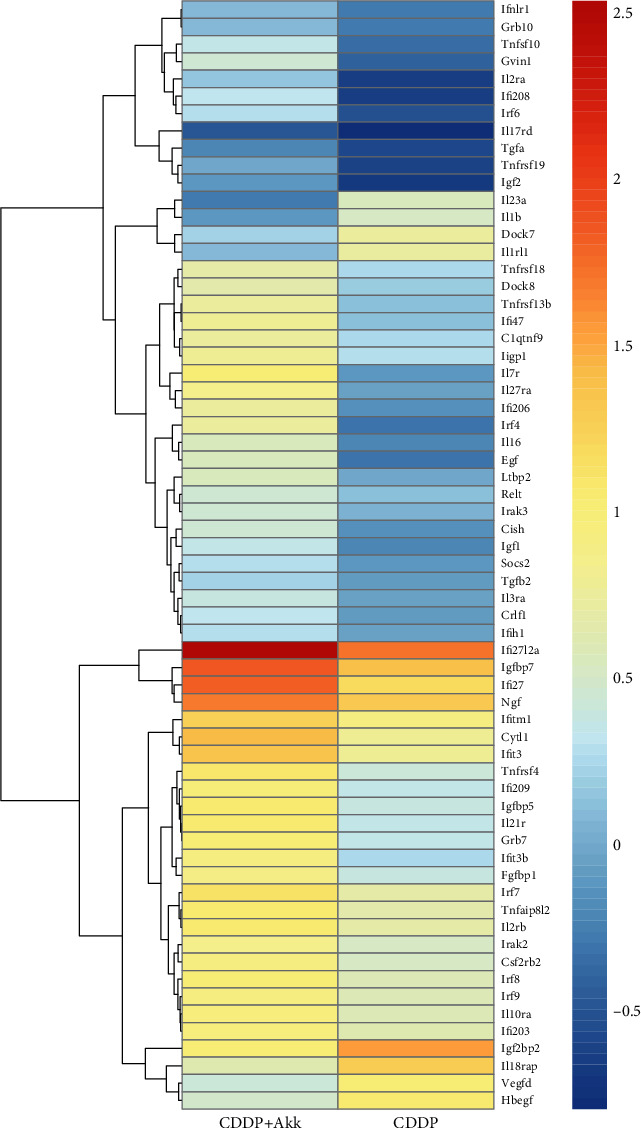
Figure 3.

Comparison of immune-related differential genes between the CDDP group and the CDDP+Akk group. The horizontal coordinate is the sample, and the vertical coordinate is the gene. Different colors represent different gene expression levels. The color ranges from blue to white to red, indicating low to high expression levels. High-expression genes are shown in red and low-expression genes are shown in dark blue.
