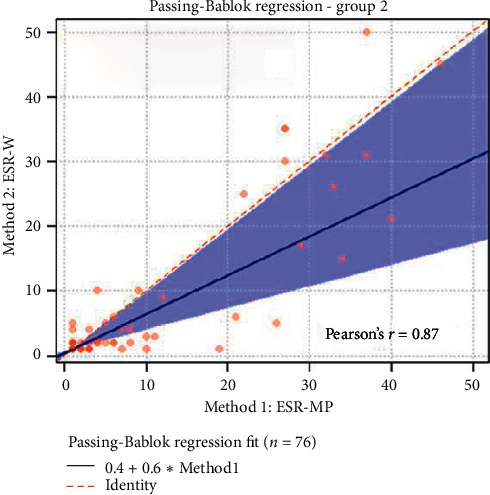
Figure 2.

The Passing-Bablok regression of group 2 (nonanemic blood samples). ESR-W, erythrocyte sedimentation rate using the Westergren method; ESR-MP, erythrocyte sedimentation rate using the MINIPET device. Additional information: intercept-systematic difference was 0.40 (95% CI: 0.02 to 0.67); slope-proportional difference was 0.60 (95% CI: 0.33 to 0.98).
