Figure 6.

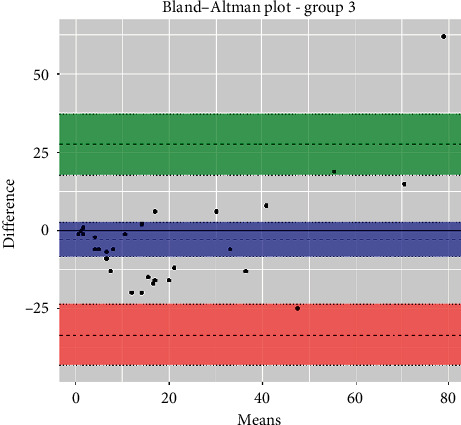
The Bland–Altman plot of group 3 (anemic blood samples). Additional information: upper limit was 28.1 (95% CI: 18.0 to 38.1) (green); mean difference was 3.9 (95% CI: 9.7 to 1.9) (blue); lower limit was 35.9 (95% CI: 45.9 to 25.9) (red).

The Bland–Altman plot of group 3 (anemic blood samples). Additional information: upper limit was 28.1 (95% CI: 18.0 to 38.1) (green); mean difference was 3.9 (95% CI: 9.7 to 1.9) (blue); lower limit was 35.9 (95% CI: 45.9 to 25.9) (red).