Figure 2.

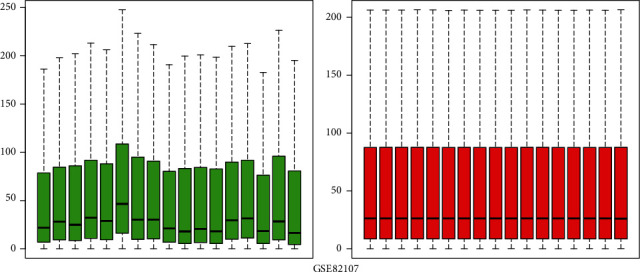
Boxplots of GSE82107 data prior to and following normalization. The red box plots represent the normalized data, and the green box plots represent the data before normalization.

Boxplots of GSE82107 data prior to and following normalization. The red box plots represent the normalized data, and the green box plots represent the data before normalization.