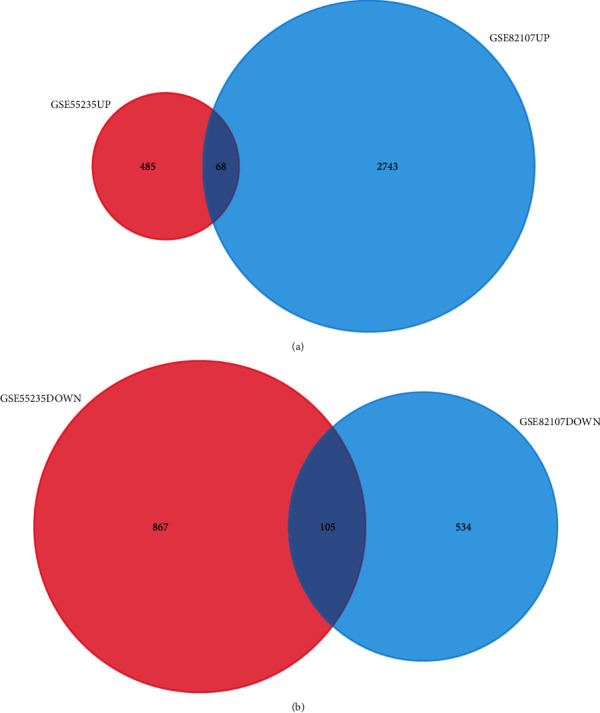
Figure 3.

The Venn analysis of upregulated and downregulated DEGs. (a) The Venn analysis of upregulated DEGs showed there are 68 DEGs coexpressed in two gene profiles. (b) The Venn analysis of downregulated DEGs presented there are 105 DEGs that were coexpressed in two gene profiles.
