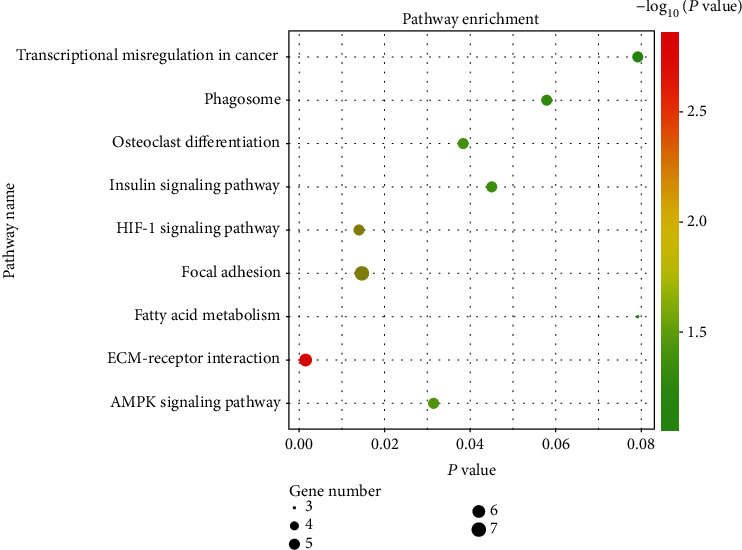
Figure 5.

Kyoto Encyclopedia of Genes and Genomes (KEGG) enrichment analysis of the pathways. The size of the black spots stands for the gene number; the gradual color stands for the P value.

Kyoto Encyclopedia of Genes and Genomes (KEGG) enrichment analysis of the pathways. The size of the black spots stands for the gene number; the gradual color stands for the P value.