Figure 6.

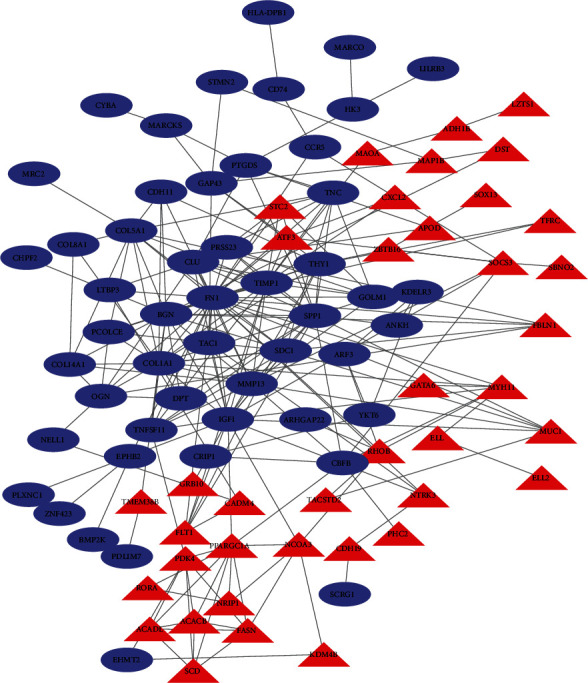
PPI network constructed with the downregulated and upregulated DEGs. Blue nodes represent upregulated genes, and red nodes represent downregulated genes. The size of the triangles and circles represents the degree value.

PPI network constructed with the downregulated and upregulated DEGs. Blue nodes represent upregulated genes, and red nodes represent downregulated genes. The size of the triangles and circles represents the degree value.