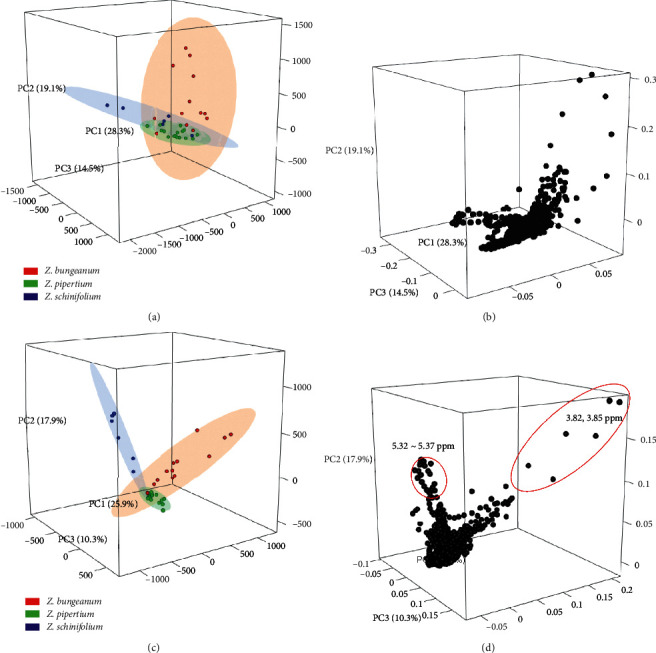
Figure 2.

The multivariate plots of three Zanthoxylum species based on the 1H NMR spectra. (a) The PCA score plot with 95% density ellipses. (b) The PCA loading plot. (c) The PLS-DA score plot with 95% density ellipses. (d) The PLS-DA loading plot. The red circles in the PLS-DA loading plot show the variables contributing to the separation of Z. bungeanum and Z. schinifolium samples.
