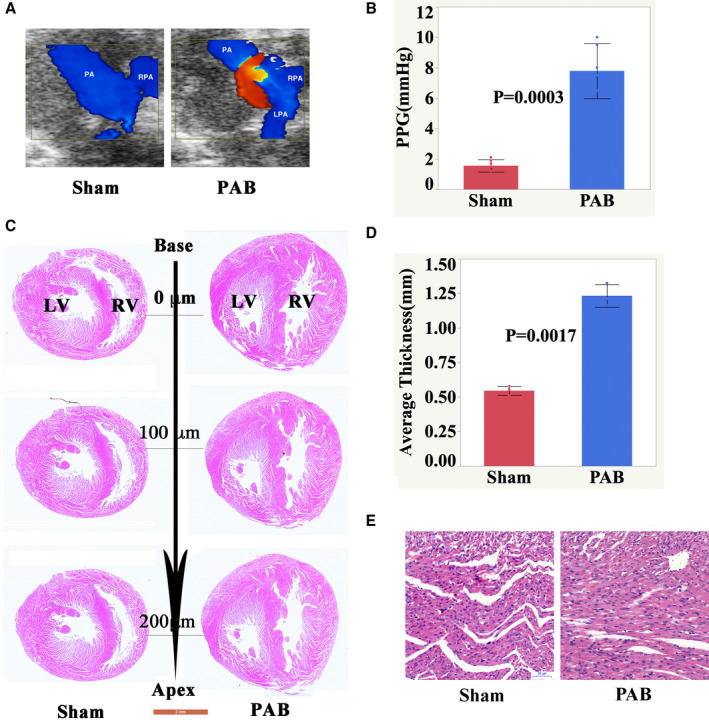
Figure 1. Establishment of right ventricular pressure overload model.

A, Representative echocardiographic images at P7 after sham and PAB surgery in neonatal rats. B, Graphical comparison of the PPG across PA constriction measured by transthoracic echocardiography between the sham and PAB groups. Data are presented as means±SD. Statistical analysis was performed using 2‐tailed Student t tests. C, H&E‐stained 2‐chamber cross sections of a P7 heart (Scale bar: 2 mm). D, High magnification of H&E‐stained sections of P7 RV. E, High magnification of H&E‐stained sections of P7 right ventricle (Scale bar: 50 μm). H&E indicates hematoxylin and eosin; LPA, left pulmonary artery; LV, left ventricle; PA, pulmonary artery; PAB, pulmonary artery banding; PPG, peak pressure gradient; RPA, right pulmonary artery; and RV, right ventricle.
