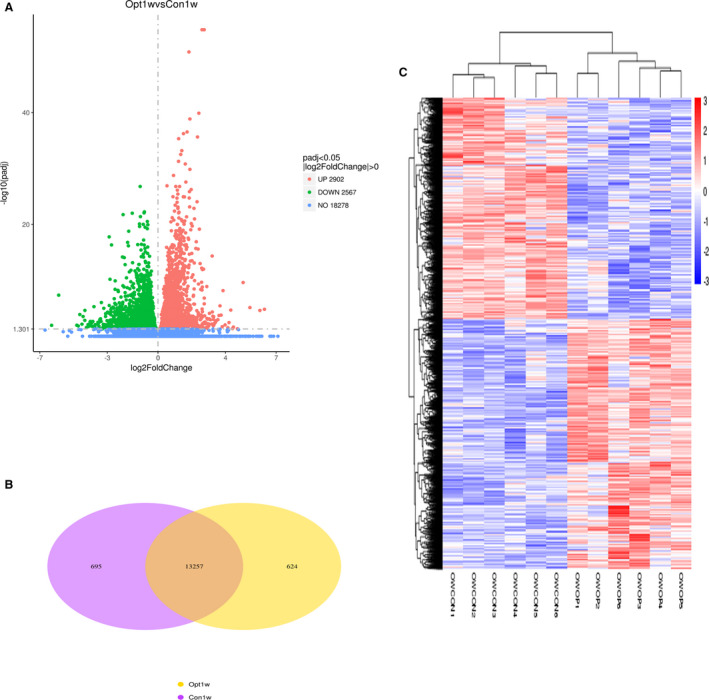
Figure 2. Pressure overload greatly changes gene expression of cardiomyocytes.

A, Volcano map of differentially expressed genes. There were 5469 differentially expressed genes between PAB (Operation‐1 week, Opt1w) and sham (control‐1 week, Con1w) groups, among which, 2902 genes were upregulated, and 2567 genes were downregulated. B, Venn diagram of differentially expressed genes. There were 13 257 genes expressed in both groups, 624 genes expressed only in the PAB group, and 695 genes expressed only in the sham group. C, Cluster analysis of differentially expressed genes. Every group had 6 rats. The clusters of genes in each animal in the same group were similar to each other but quite different from the other group. OWOP is from the PAB group; OWCON is from the sham group. OWCON indicates Operationer Wang‐Control; OWOP, Operationer Wang‐operationl; and PAB, pulmonary artery banding.
