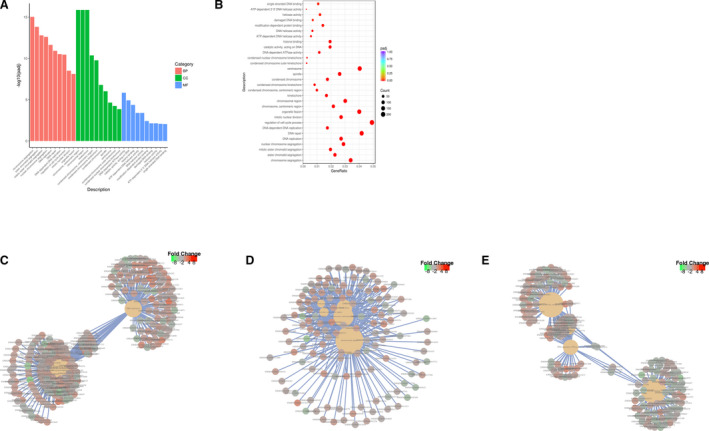
Figure 3. GO analysis indicates that the differentially expressed genes mainly mediate mitosis and cell division.

A, From the results of the GO enrichment analysis, the most significant 30 terms are displayed. The abscissa is the GO Term, and the ordinate is the significance level of GO Term enrichment. The higher the value, the more significant, and the different colors represent 3 different GO subclasses: biological process (BP), (CC), and MF. B, From the results of the GO enrichment analysis, we selected the most significant 30 terms to draw scatterplots for display. The abscissa is the ratio of the number of differentially expressed genes on the GO Term to the total number of differentially expressed genes, the ordinate is the GO Term, the size of the dots represents the number of genes annotated to the GO Term, and the color from red to purple represents the significance level of GO Term enrichment. C, A network diagram of the top 5 most significant GO Terms in BP. D, A network diagram of the top 5 most significant GO Terms in BP in MF in CC. E, A network diagram of the top 5 most significant GO Terms in biological processes in molecular functions. BP indicates biological processes; CC, cellular components; GO, gene ontology; and MF, molecular function.
