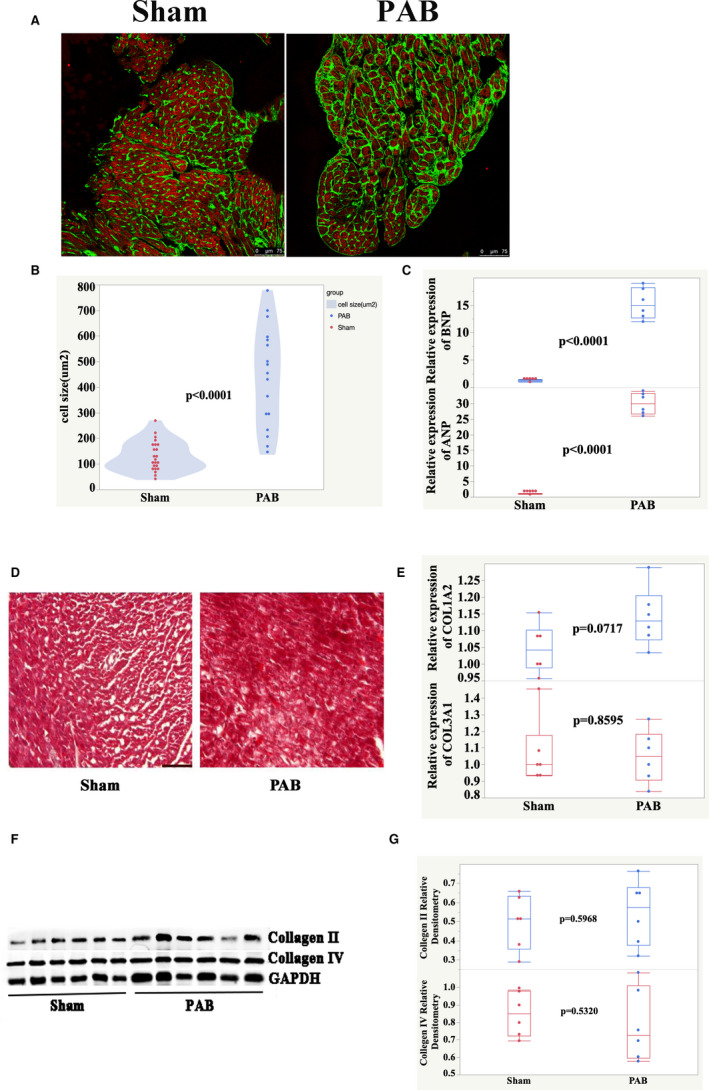
Figure 7. Cardiomyocytes hypertrophy without fibrosis in pressure overload model.

A, Heart sections were stained with Alexa 488‐conjugated WGA (green), cardiac troponin T (red), and DAPI (blue). B, Quantification of cell size. C, qPCR analysis of mRNA expression levels for cardiac hypertrophy markers ANP and BNP. D, Trichrome green–stained sections of RV. Scale bar, 50 μm. E, qPCR analysis of mRNA expression levels for cardiac fibrosis markers Col1a2 and Col3a1. F, Detection of collagen II and IV from P7 rat hearts by Western blot. G, Quantification of Western blot bands from (F). ANP indicates atrial natriuretic peptide; BNP, brain natriuretic peptide; DAPI, 4′,6‐diamidino‐2‐phenylindole; PAB, pulmonary artery banding; qPCR, quantitative real‐time polymerase chain reaction; and RV, right ventricle.
