
Figure 3. Dose‐response meta‐analysis of changes in systolic blood pressure (SBP) and diastolic blood pressure (DBP) levels (as mm Hg), according to achieved potassium excretion levels between arms (potassium supplemented and control group) at the end of the trials.
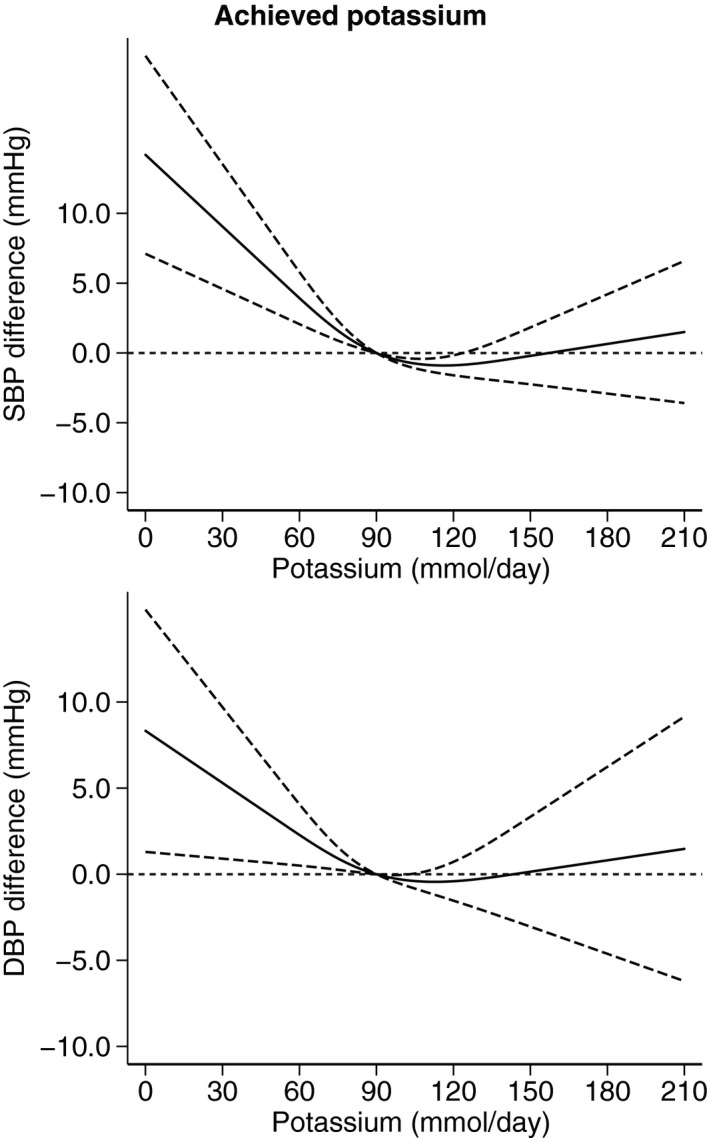
All studies included (N=32). Spline curve (solid line) with 95% confidence limits (long dashed lines).