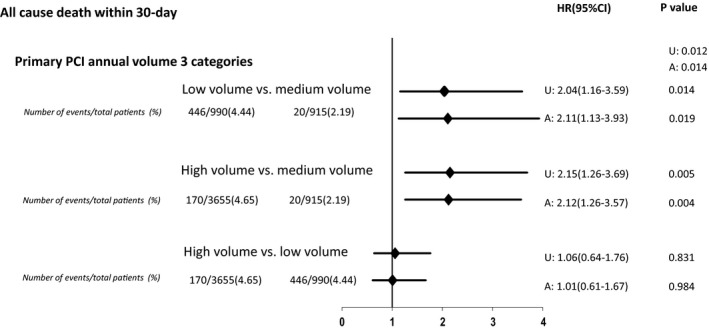
Figure 3. Hazard ratios (HRs) of 30‐day all‐cause mortality between hospital groups, categorized into low‐, medium‐, and high‐volume, according to the annual institutional primary percutaneous coronary intervention (PCI) volume.

A indicates adjusted for sex, CI, confidence interval, TIMI (Thrombolysis in Myocardial Infarction) risk score, insurance coverage, living in poverty, family history, smoking status, culprit lesion in proximal left anterior descending artery, number of years catheterization laboratory was performing percutaneous coronary interventions, and year of enrollment. U, unadjusted.
